

Question: If the answer can be configured using Excel formulas, please show how... Sample Mean Range 1 7.1 .52 2 6.92 .48 3 7.25 .5 4
If the answer can be configured using Excel formulas, please show how...
| Sample | Mean | Range |
| 1 | 7.1 | .52 |
| 2 | 6.92 | .48 |
| 3 | 7.25 | .5 |
| 4 | 7.54 | .51 |
| 5 | 7.21 | .46 |
| 6 | 8.01 | .55 |
| 7 | 7.8 | .53 |
| 8 | 7.63 | .49 |
Using factors from Table 10.3 determine upper and lower control limits for mean and range charters, and decide if the process is in control.
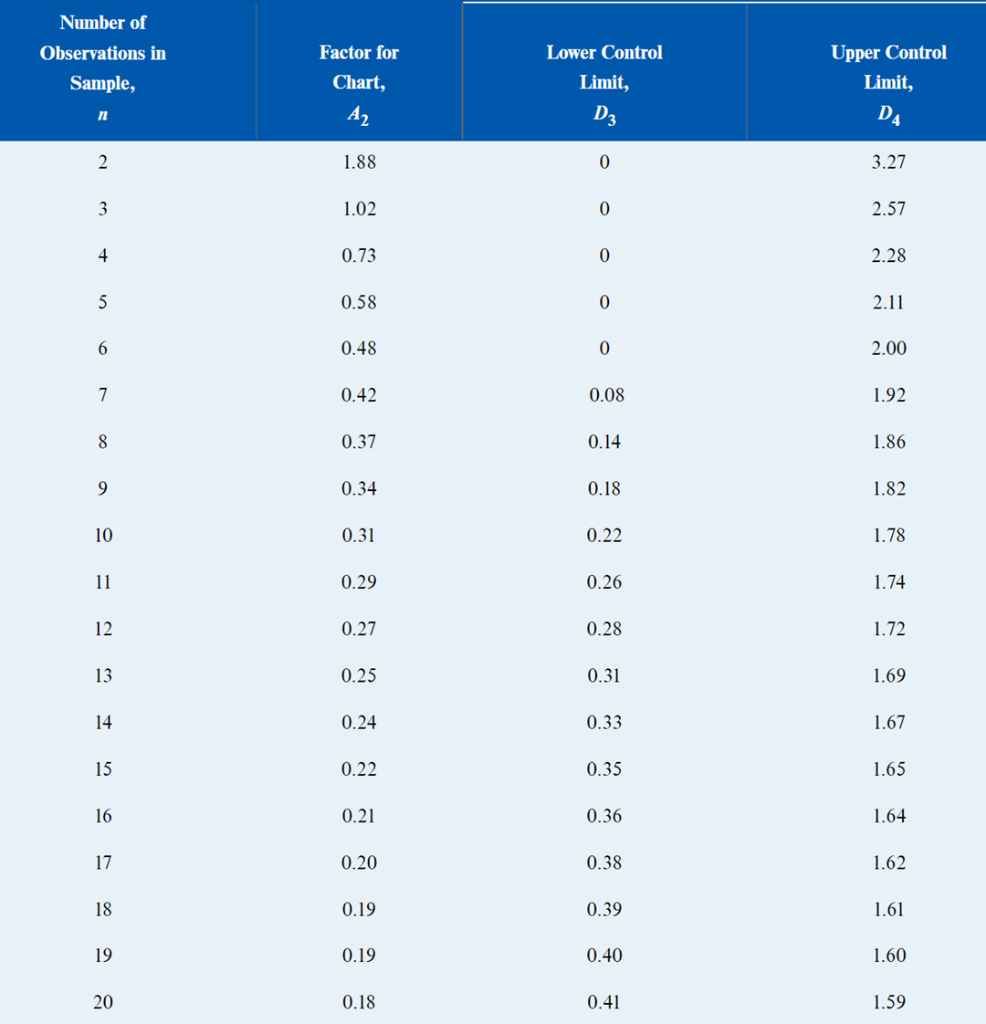 Table 10.3, above.
Step by Step Solution
There are 3 Steps involved in it
1 Expert Approved Answer
Step: 1 Unlock

Question Has Been Solved by an Expert!
Get step-by-step solutions from verified subject matter experts
Step: 2 Unlock
Step: 3 Unlock