

Question: i just need the charts please! Construct a 3 sigma mean chart: Construct a 3 sigma range chart: @ Chapter 10 Security Camera Problem -
i just need the charts please! 
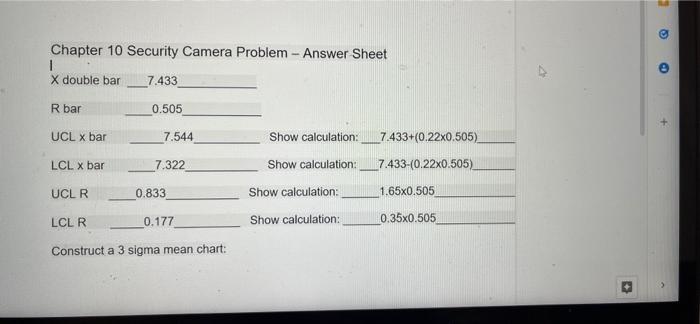
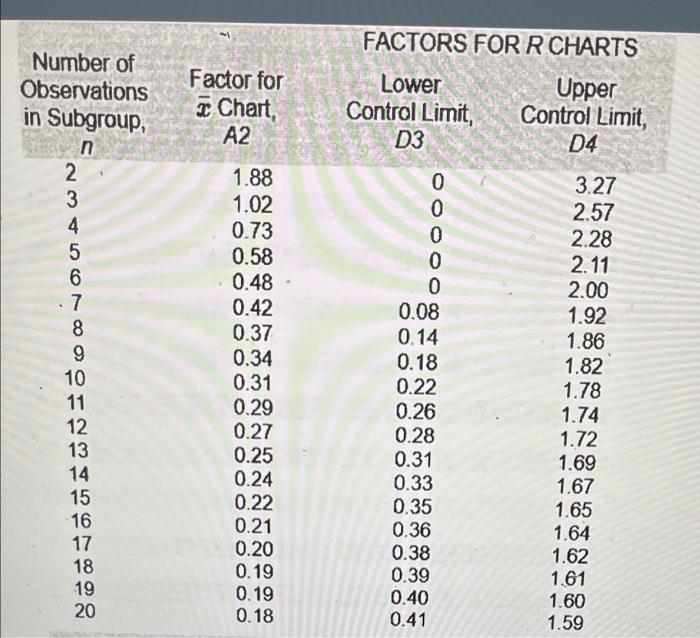
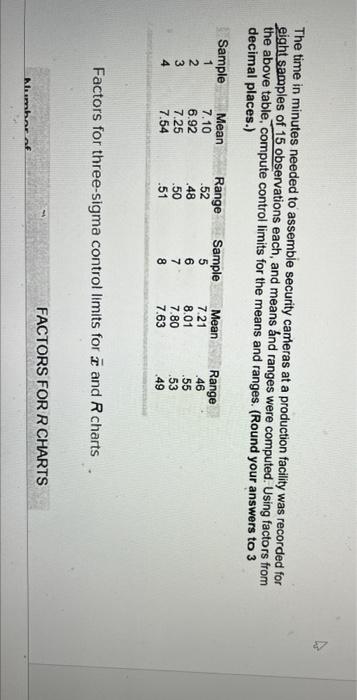
Construct a 3 sigma mean chart: Construct a 3 sigma range chart: @ Chapter 10 Security Camera Problem - Answer Sheet I X double bar _7.433 R bar 0.505 UCL X bar 7.544 Show calculation: 7.433+0.22x0.505) LCL X bar 7.322 _7.433-(0.22x0.505) UCLR 0.833 Show calculation: Show calculation: Show calculation: 1.65x0.505 LCL R 0.177 0.35x0.505 Construct a 3 sigma mean chart: > Factor for 3 Chart A2 FACTORS FOR R CHARTS Lower Upper Control Limit Control Limit D3 04 0 OOC Number of Observations in Subgroup, n 2 3 4 5 6 7 8 9 10 11 12 13 14 15 16 17 18 19 20 1.88 1.02 0.73 0.58 0.48 0.42 0.37 0.34 0.31 0.29 0.27 0.25 0.24 0.22 0.21 0.20 0.19 0.19 0.18 0 0 0 0.08 0.14 0.18 0.22 0.26 0.28 0.31 0.33 0.35 0.36 0.38 0.39 0.40 0.41 3.27 2.57 2.28 2.11 2.00 1.92 1.86 1.82 1.78 1.74 1.72 1.69 1.67 1.65 1.64 1.62 1.61 1.60 1.59 The time in minutes needed to assemble security cameras at a production facility was recorded for eight samples of 15 observations each, and means and ranges were computed. Using factors from the above table, compute control limits for the means and ranges. (Round your answers to 3 decimal places.) Sample Mean Range Sample Mean Range 7.10 52 5 721 46 2 6.92 .48 6 8.01 .55 3 7.25 .50 7 7.80 53 4 7.54 .51 8 7.63 49 1 . Factors for three-sigma control limits for i and R charts FACTORS FOR R CHARTS Amhar af
Step by Step Solution
There are 3 Steps involved in it
1 Expert Approved Answer
Step: 1 Unlock

Question Has Been Solved by an Expert!
Get step-by-step solutions from verified subject matter experts
Step: 2 Unlock
Step: 3 Unlock