

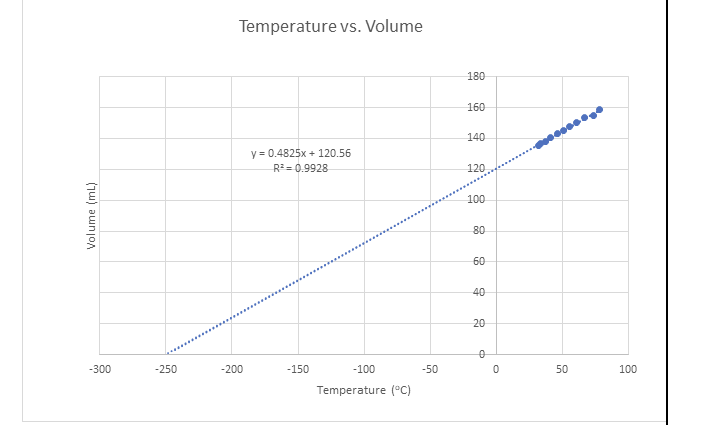
If the points shown as squares in the plot of volume versus temperature shown above had been
Fantastic news! We've Found the answer you've been seeking!
Question:
If the points shown as squares in the plot of volume versus temperature shown above had been included in the calculation of the trendline, would the calculated value of C be too high, too low, or remain unchanged? Justify your answer.
Expert Answer:
I cannot see the points which are marked as squares in the image you are referring to which seems to ... View the full answer

Related Book For 

Posted Date:
