

Question: If the return on your stock equals the expected return indicated by the CAPM next year (as computed in c.1 (CAPM = 4.81%) and then
If the return on your stock equals the expected return indicated by the CAPM next year (as computed in c.1 (CAPM = 4.81%) and then suffers a return of negative 98% in the subsequent year, show what is the geometric average return on the stock over those two years (i.e., the compounded annual return)?
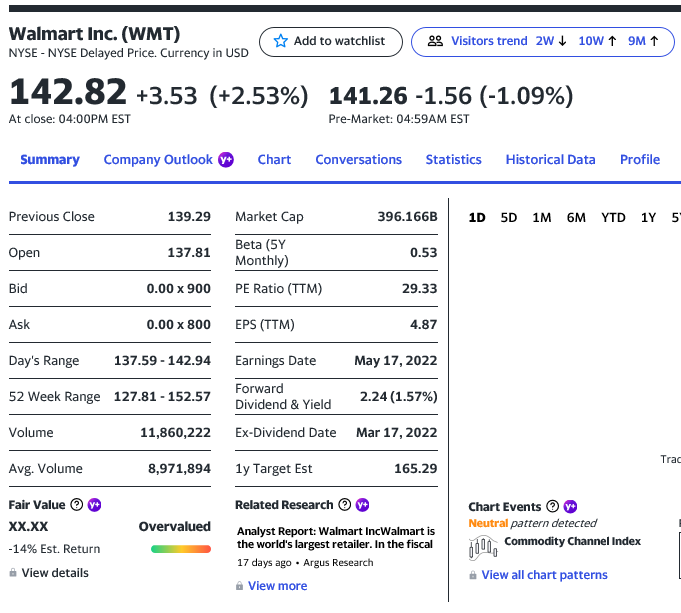
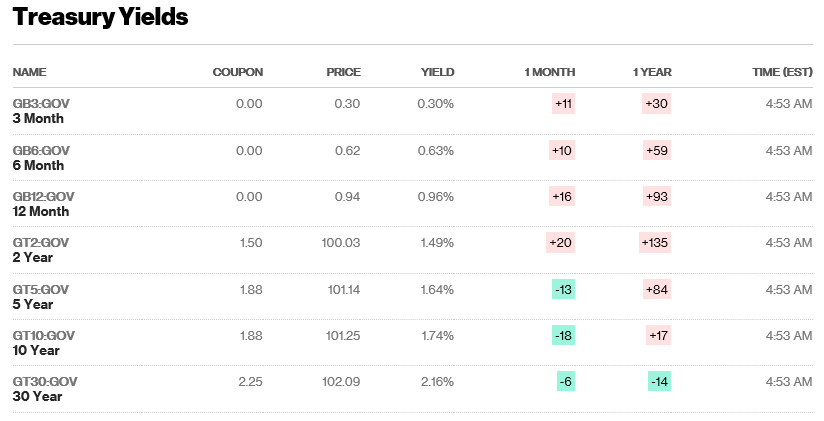
Walmart Inc. (WMT) NYSE - NYSE Delayed Price. Currency in USD # Add to watchlist Visitors trend 2W 10W 9M 1 142.82 +3.53 (+2.53%) 141.26 -1.56 (-1.09%) At close: 04:00PM EST Pre-Market: 04:59AM EST Summary Company Outlook Chart Conversations Statistics Historical Data Profile Previous Close 139.29 Market Cap 396.166B 1D 5D 1M 6M YTD 1Y 5 in Open 137.81 Beta (5Y Monthly) 0.53 Bid 0.00 x 900 PE Ratio (TTM) 29.33 Ask 0.00 x 800 EPS (TTM) 4.87 Day's Range 137.59 -142.94 52 Week Range 127.81 - 152.57 Earnings Date May 17, 2022 Forward Dividend & Yield 2.24 (1.57%) Ex-Dividend Date Mar 17, 2022 Volume 11,860,222 Trac Avg. Volume 8,971,894 1y Target Est 165.29 Overvalued Fair Value XX.XX -14% Est. Return View details Related Research Analyst Report: Walmart IncWalmart is the world's largest retailer. In the fiscal 17 days ago. Argus Research A View more Chart Events Neutral pattern detected jll, Commodity Channel Index A View all chart patterns Treasury Yields NAME COUPON PRICE YIELD 1 MONTH 1 YEAR TIME (EST) 0.00 0.30 0.30% +11 +30 GB3-GOV 3 Month 4:53 AM 0.00 0.62 0.63% +10 +59 GB6-GOV 6 Month 4:53 AM 0.00 0.94 0.96% +16 +93 4:53 AM GB12.GOV 12 Month 1.50 100.03 1.49% +20 +135 4:53 AM GT2GOV 2 Year 1.88 101.14 1.64% -13 +84 GT5.GOV 5 Year 4:53 AM 1.88 10125 1.74% -18 +17 4:53 AM GT10-GOV 10 Year 2.25 102.09 2.16% -6 -14 4:53 AM GT30.GOV 30 Year
Step by Step Solution
There are 3 Steps involved in it

Get step-by-step solutions from verified subject matter experts