

Question: If you are unable to view the graph: It is a Demand, Private Cost, and Social Cost graph. The Social Cost is higher than the

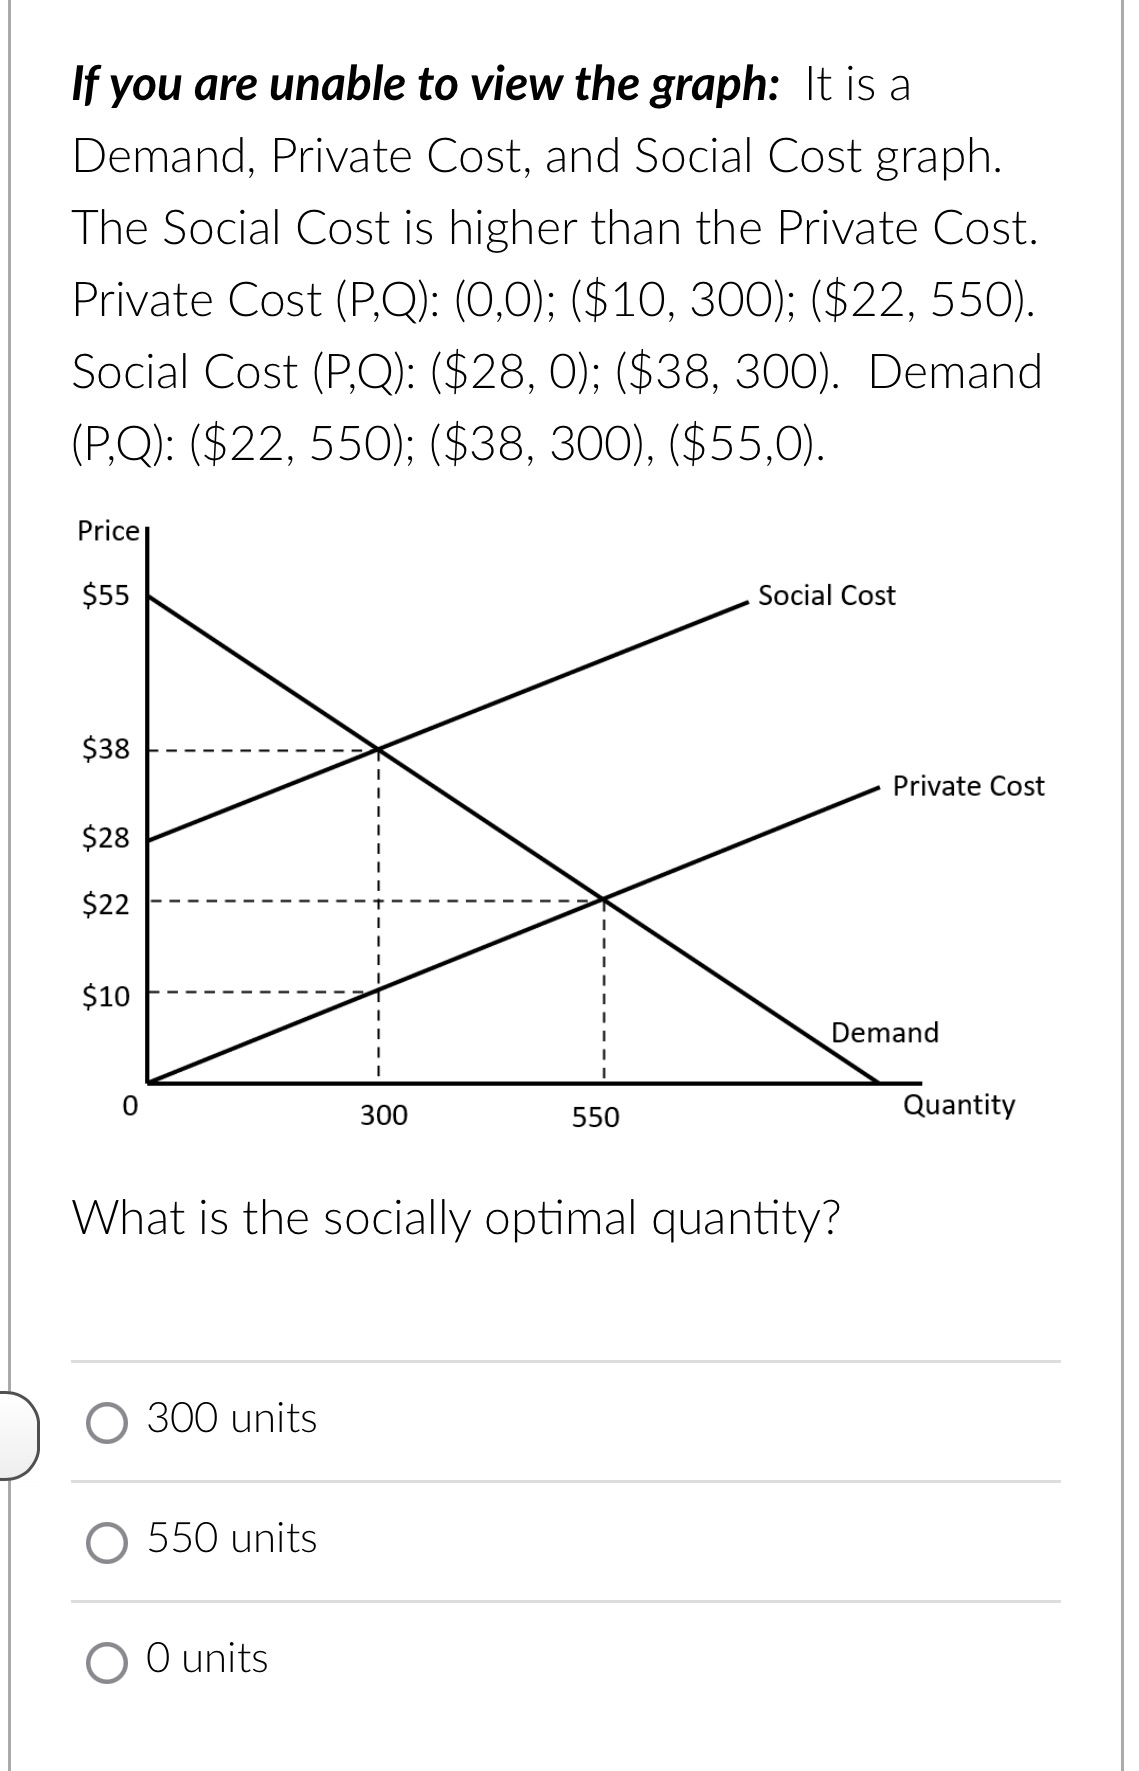
If you are unable to view the graph: It is a Demand, Private Cost, and Social Cost graph. The Social Cost is higher than the Private Cost. Private Cost (P.Q): (0,0); ($10, 300); ($22, 550). Social Cost (PQ): ( $28 O ($38, 300). Demand ): ($22, 550); ($38, 300), ($55,0). Price S55 Social Cost $38 Private Cost $28 $22 $10 0 300 550 U What is the socially optimal quantity? (O 300 units (O 550 units O O units
Step by Step Solution
There are 3 Steps involved in it
1 Expert Approved Answer
Step: 1 Unlock

Question Has Been Solved by an Expert!
Get step-by-step solutions from verified subject matter experts
Step: 2 Unlock
Step: 3 Unlock