

Question: If you do not know how to answer the questions, please Do not copy the answer that someone already answered the same question because it
If you do not know how to answer the questions, please Do not copy the answer that someone already answered the same question because it is wrong and waste my quesions chance .
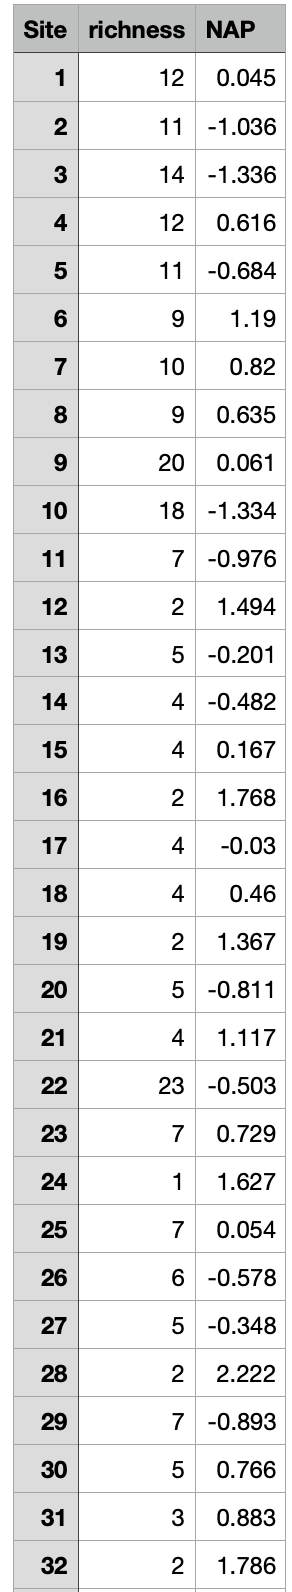
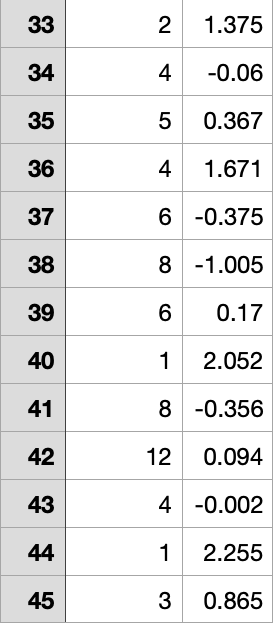
Janssen et al. (2007) studied how a variety of abiotic factors influences benthic invertebrate abundance at sites on beaches along the Dutch coast. One of these abiotic factors was the relative height of the site in relationship to the average sea level of the area (NAP). Positive values of NAP indicate sites that are higher than the average sea level, whereas negative values indicate sites that are below the average sea level.
The data are in table and the relevant variables are richness (number of invertebrate species at a site), and NAP (relative height of the site in relationship to the average sea level of the area).
Janssen et al. (2007) were interested in modeling the relationship between invertebrate richness and the relative height of the site in relationship to the average sea level, and whether the latter can be used to predict variation in the former.
Question 1 :Given the information above, which type of test is MOST suitable for analyzing these data to achieve the researchers goals?
Spearman's correlation
Pearson's correlation
Linear regression
Levene's test
Question 2 :What are the sampling units in this analysis?
The different heights above sea level being sampled
The 45 sites from which the measures were taken
The invertebrate species being collected
The individual invertebrates being collected
Question 3 :What is the response variable?
Species richness (richness)
The site for which data are being collected (Site)
Height above sea level (NAP)
Question 4 :What is the null hypothesis in regard to the relationship being studied here?
There is no relationship between invertebrate richness and the relative height of the site (NAP)
There is a relationship between invertebrate richness and the relative height of the site (NAP)
There is a positive relationship between invertebrate richness and the relative height of the site (NAP)
There is a negative relationship between invertebrate richness and the relative height of the site (NAP)
Question 5 :Draw a scatterplot of richness against NAP, including boxplots for each variable as well, and the best-fit regression line to view the trend and a smoothed line. Is there any evidence that the assumptions are not met?
Yes, the variance is not constant, outliers are present and are related to the large variance. However, the data is linear, and the response variable is normally distributed.
No, all assumptions are met. The variance is constant, there are no outliers, the data is linear and normally distributed.
Yes, the variance is not constant, outliers are present and are related to the large variance. However, the data is curvilinear, and the response variable is normally distributed.
Yes, the variance is not constant, outliers are present and are related to the large variance, the data is curvilinear, and the response variable is not normal.
Site 1 2 3 4 5 6 7 8 9 10 11 12 13 14 15 16 17 18 19 20 21 22 23 24 25 26 27 28 29 30 31 32 richness NAP 12 0.045 11 -1.036 14 -1.336 12 0.616 11 -0.684 9 1.19 10 0.82 9 0.635 20 0.061 18 -1.334 7 -0.976 2 1.494 5 -0.201 4 -0.482 4 0.167 2 1.768 4 -0.03 4 0.46 2 1.367 5 -0.811 4 1.117 23 -0.503 7 0.729 1 1.627 7 0.054 6 -0.578 5 -0.348 2 2.222 7 -0.893 5 0.766 3 0.883 2 1.786 33 34 35 36 37 38 39 40 41 42 43 44 45 2 1.375 4 -0.06 5 0.367 4 1.671 6 -0.375 8 -1.005 6 0.17 12.052 8 -0.356 0.094 4 -0.002 1 2.255 3 0.865 12 Site 1 2 3 4 5 6 7 8 9 10 11 12 13 14 15 16 17 18 19 20 21 22 23 24 25 26 27 28 29 30 31 32 richness NAP 12 0.045 11 -1.036 14 -1.336 12 0.616 11 -0.684 9 1.19 10 0.82 9 0.635 20 0.061 18 -1.334 7 -0.976 2 1.494 5 -0.201 4 -0.482 4 0.167 2 1.768 4 -0.03 4 0.46 2 1.367 5 -0.811 4 1.117 23 -0.503 7 0.729 1 1.627 7 0.054 6 -0.578 5 -0.348 2 2.222 7 -0.893 5 0.766 3 0.883 2 1.786 33 34 35 36 37 38 39 40 41 42 43 44 45 2 1.375 4 -0.06 5 0.367 4 1.671 6 -0.375 8 -1.005 6 0.17 12.052 8 -0.356 0.094 4 -0.002 1 2.255 3 0.865 12
Step by Step Solution
There are 3 Steps involved in it

Get step-by-step solutions from verified subject matter experts