

Question: If you do not want to use MathType, in the following problems for ANOVA, denote sample means as xlbar, x2bar, ..., or as xA bar,
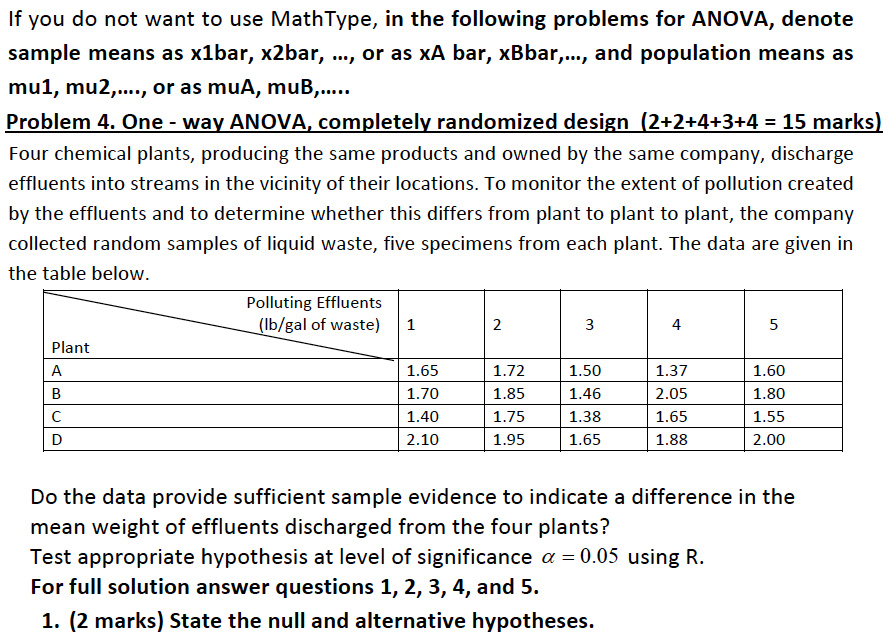
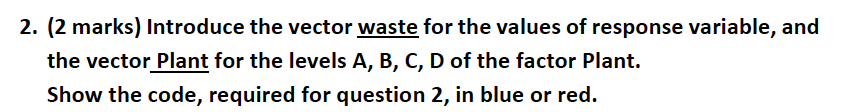
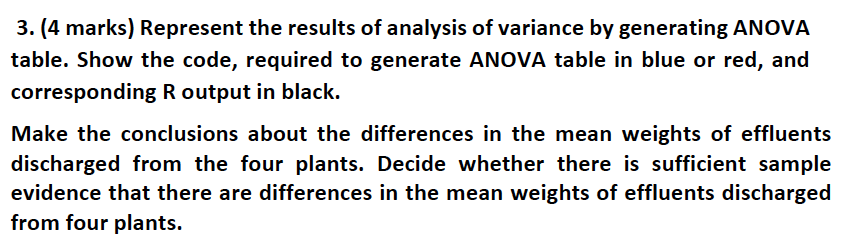
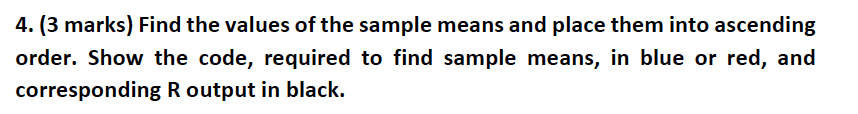
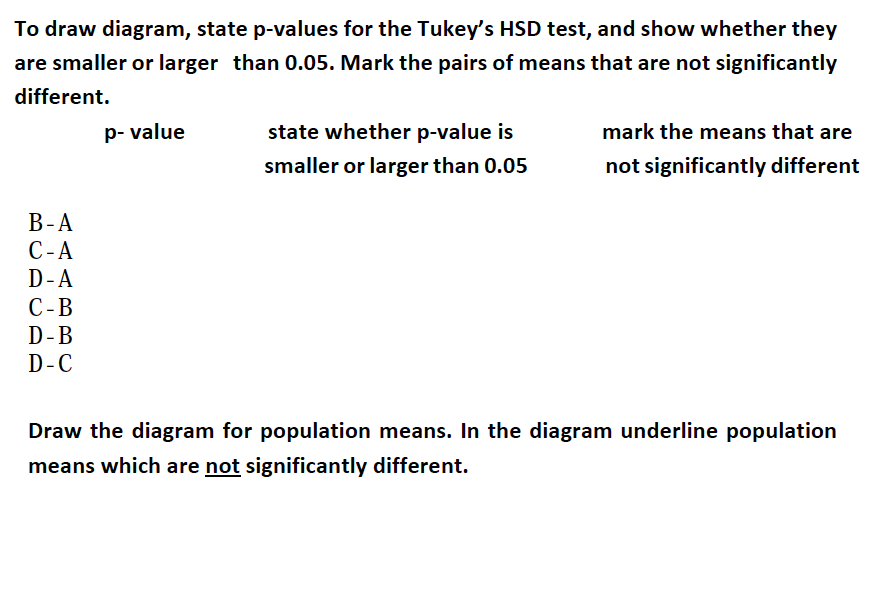
If you do not want to use MathType, in the following problems for ANOVA, denote sample means as xlbar, x2bar, ..., or as xA bar, biar,..., and population means as mu1, mu2,...., or as muA, muB,..... Problem 4. One - wa ANOVA com letel randomized desi n 2+2+4+3+4 = 15 marks Four chemical plants, producing the same products and owned by the same company, discharge effluents into streams in the vicinity of their locations. To monitor the extent of pollution created by the effluents and to determine whether this differs from plant to plant to plant, the company collected random samples of liquid waste, five specimens from each plant. The data are given in the table below. Polluting Effluents [be'gal of waste} 1 2 3 4 5 Plant A 1.65 1.72 1.50 1.37 1.60 B 1.70 1.85 1.46 2.05 1.80 C 1.40 1.?5 1.38 1.65 1.55 D 2.10 1.95 1.65 1.38 2.00 Do the data provide sufficient sample evidence to indicate a difference in the mean weight of effluents discharged from the four plants? Test appropriate hypothesis at level of significance or = 0.05 using R. For full solution answer questions 1, 2, 3, 4, and 5. 1. {2 marks) State the null and alternative hypotheses. 2. (2 marks) Introduce the vector waste for the values of response variable, and the vector Plant for the levels A, B, C, D of the factor Plant. Show the code, required for question 2, in blue or red. 3. (4 marks} Represent the results of analysis of variance by generating ANOVA table. Show the code, required to generate ANOVA table in blue or red, and corresponding R output in black. Make the conclusions about the differences in the mean weights of effluents discharged from the four plants. Decide whether there is sufficient sample evidence that there are differences in the mean weights of effluents discharged from four plants. 4. (3 marks) Find the values of the sample means and place them into ascending order. Show the code, required to find sample means, in blue or red, and corresponding R output in black. 3. (4 marks) Perform Tukey's HSD test and draw the diagram for population means. Show the code, required to perform Tukey's HSD test, in blue or red, and corresponding R output in black.To draw diagram, state p-values for the Tukey's HSD test, and show whether they are smaller or larger than 0.05. Mark the pairs of means that are not significantly different. p- value state whether p-yalue is mark the means that are smaller or larger than 0.05 not significantly different 5'30an || OWUUCP'CFPTP Draw the diagram for population means. In the diagram underline population means which are n_ot significantly different
Step by Step Solution
There are 3 Steps involved in it

Get step-by-step solutions from verified subject matter experts