

Question: If you wanted to plot the same data in ggplot, how would you fill in the blank of the following expression using the script? ggplot(__________,
If you wanted to plot the same data in ggplot, how would you fill in the blank of the following expression using the script?
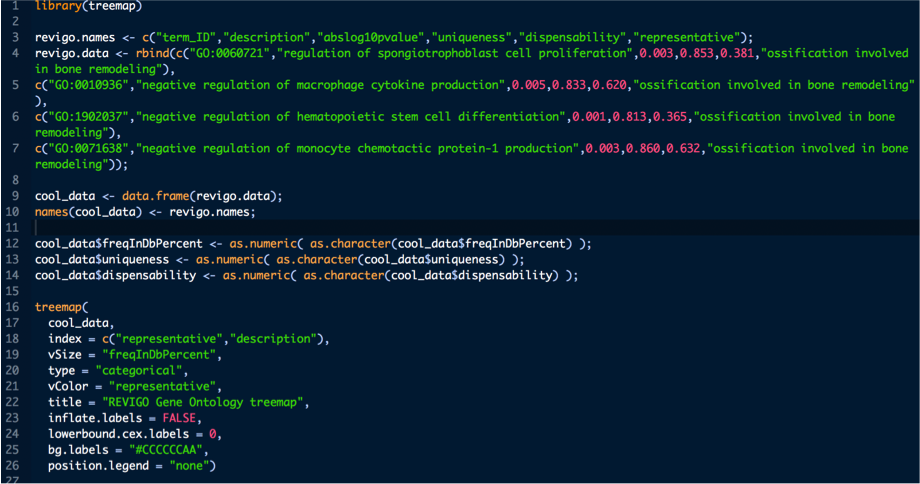
ggplot(__________, aes(x=uniqueness, y=dispensability) + geom_point()
I think the blank should be "subset" but not quite sure.
1 Hbrary ( treemap ) 3 revigo.names
Step by Step Solution
There are 3 Steps involved in it
1 Expert Approved Answer
Step: 1 Unlock

Question Has Been Solved by an Expert!
Get step-by-step solutions from verified subject matter experts
Step: 2 Unlock
Step: 3 Unlock