

Question: iI need help on this question Attempts U I U I Keepthe HighestOiZ 14. A supply and demand puzzle The following graph shows the market
iI need help on this question
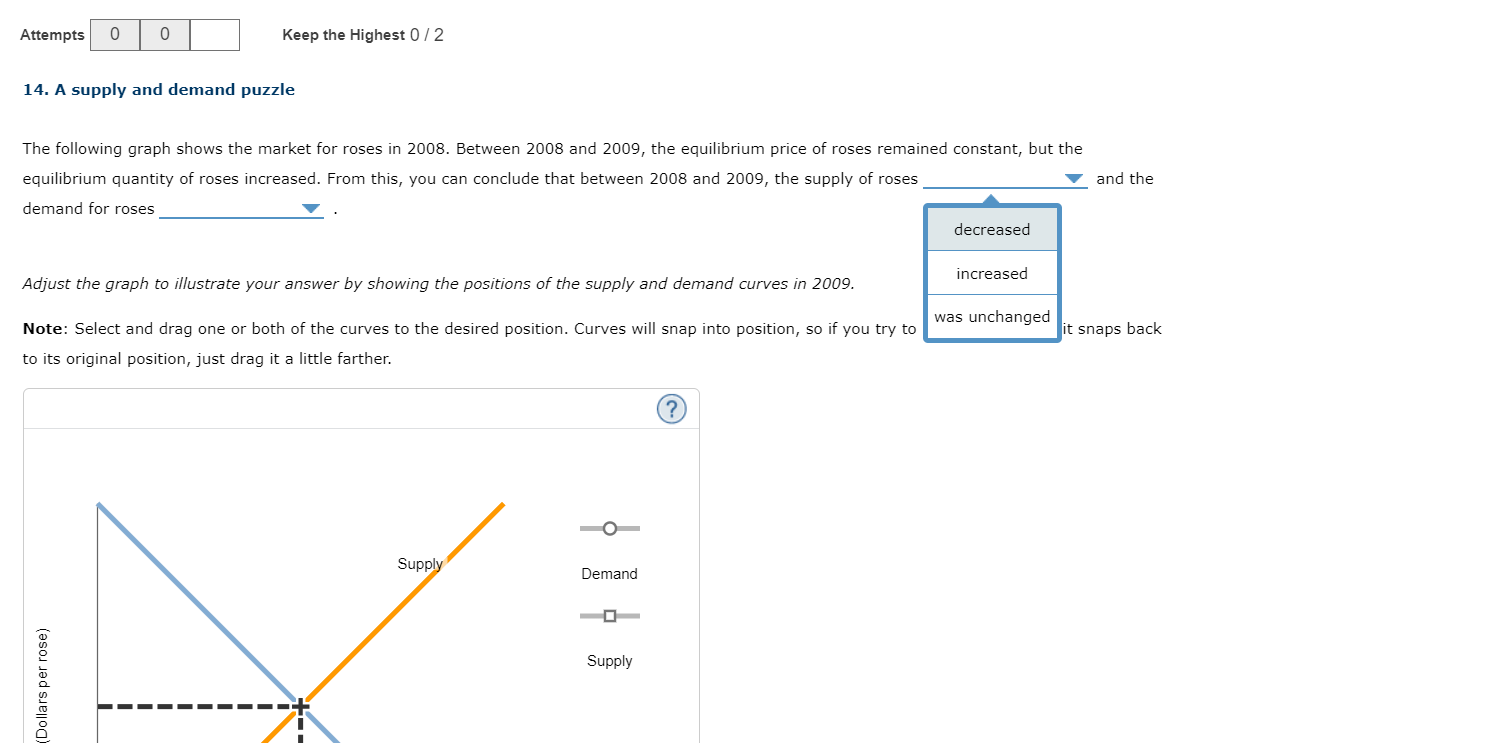
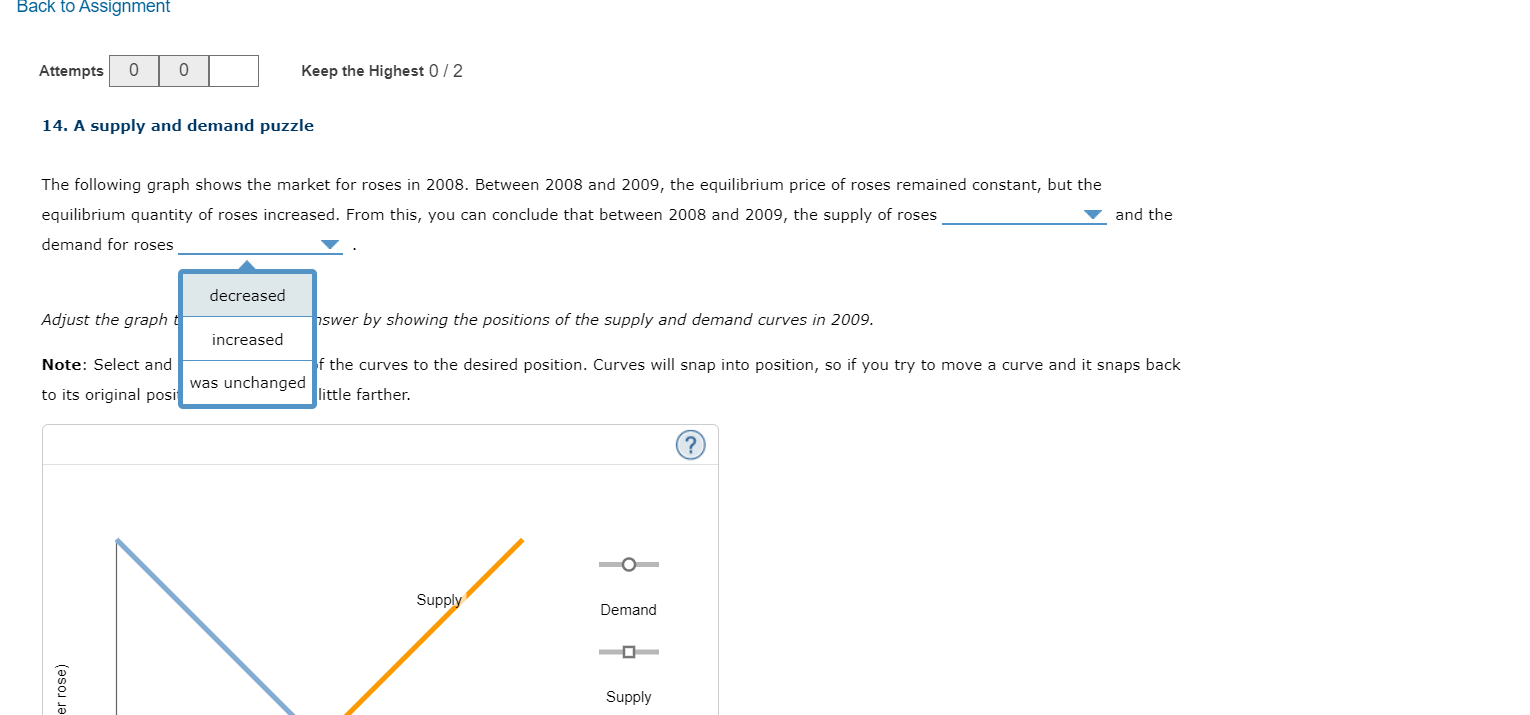
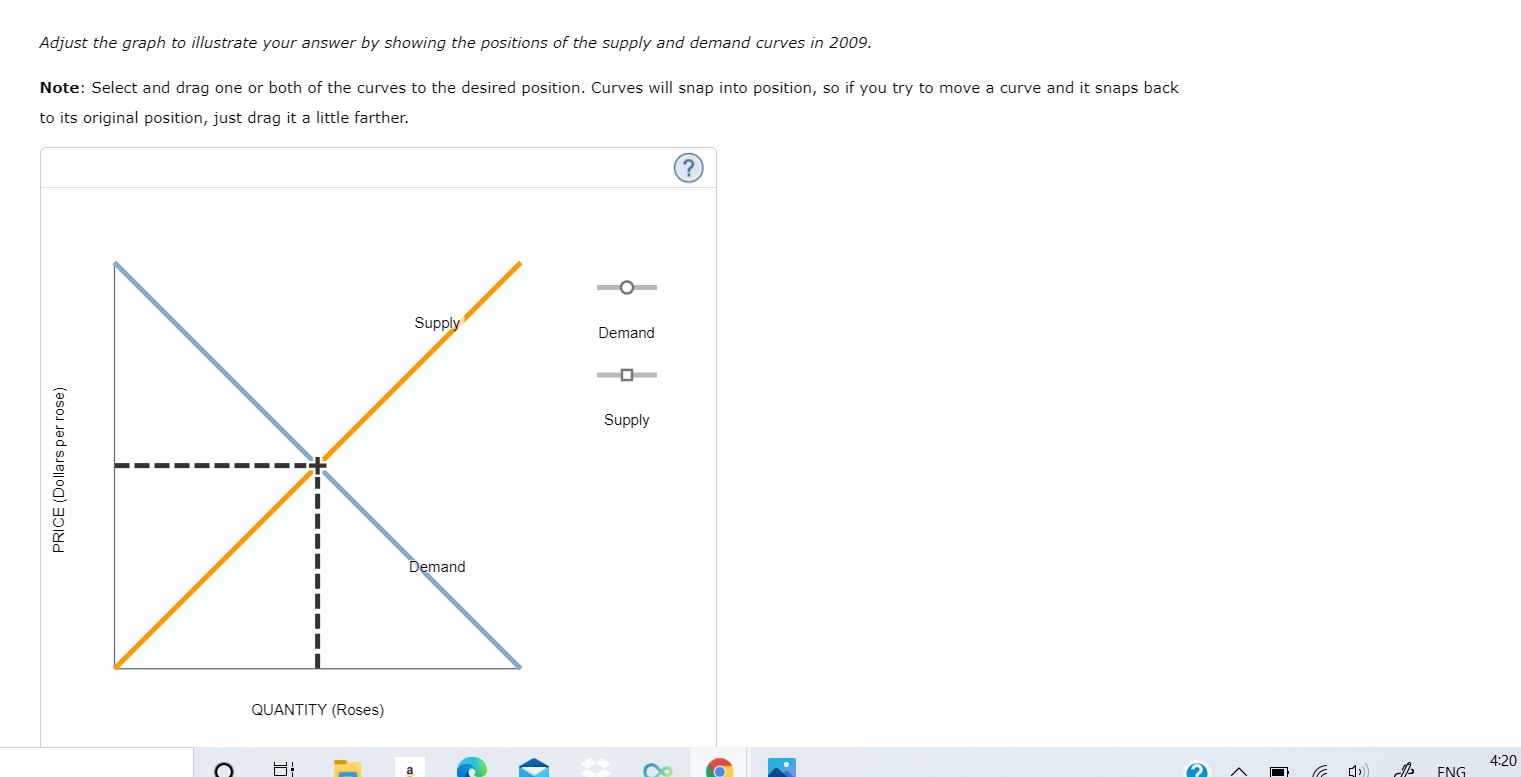
Attempts U I U I Keepthe HighestOiZ 14. A supply and demand puzzle The following graph shows the market for roses in 2008. Between 2008 and 2009, the equilibrium price of roses remained constant, but the equilibrium quantity of roses increased. From this, you can conclude that between 2008 and 2009, the supply of roses demand for roses V . Adjust the graph to illustrate your answer by showing the positions of the supply and demand curves in 2009. Note: Select and drag one or both of the curves to the desired position. Curves will snap into position, so if you try to to its original position, just drag it a little farther. (Dollars par rose) /:\\ Suppl Demand Suppry decreased increased was unchanged V and the it snaps hack Back 10 Assignment Attempts U l U I Keep the Highest 0 I 2 14. A supply and demand puzzle The following graph shows the market for roses in 2008. Between 2008 and 2009, the equilibrium price of roses remained constant, but the equilibrium quantity of roses increased. From this, you can conclude that between 2005 and 2009, the supply of roses V and the demand for roses V . decreased Adjust the graph '- swer by showing the positions of the supply and demand curves in 2009. increased Note: Select and f the curves to the desired position. Curves will snap into position, so if you try to move a curve and it snaps back . _ _ _ was unchanged _ to Its orlglnal DOSI llttle farther. / 3\" ppl Demand D Supply er ruse) Adjust the graph to illustrate your answer by showing the positions of the supply and demand curves in 2009. Note: Select and drag one or both of the curves to the desired position. Curves will snap into position, so if you try to move a curve and it snaps back to its original position, just drag it a little farther. O Supply Demand Supply PRICE (Dollars per rose) Demand QUANTITY (Roses) 4:20 ENG
Step by Step Solution
There are 3 Steps involved in it

Get step-by-step solutions from verified subject matter experts