

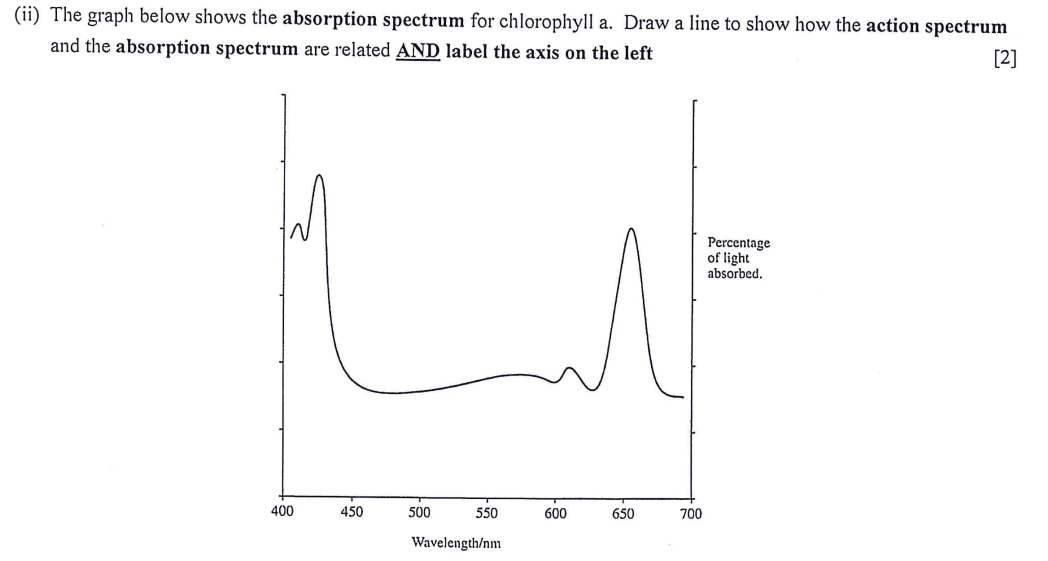
Question: (ii) The graph below shows the absorption spectrum for chlorophyll a. Draw a line to show how the action spectrum and the absorption spectrum are
Step by Step Solution
There are 3 Steps involved in it
1 Expert Approved Answer
Step: 1 Unlock

Question Has Been Solved by an Expert!
Get step-by-step solutions from verified subject matter experts
Step: 2 Unlock
Step: 3 Unlock