

Question: (ii The table below is an extract from an Excel spreadsheet showing petrol and diesel fuel consumption (litres/100km) for different engine sizes (cc) for the
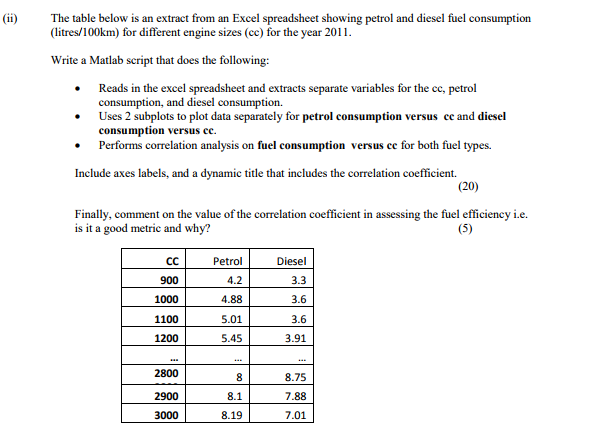
(ii The table below is an extract from an Excel spreadsheet showing petrol and diesel fuel consumption (litres/100km) for different engine sizes (cc) for the year 2011 Write a Matla b script that does the following: Reads in the excel spreadsheet and extracts separate variables for the cc, petrol consumption, and diesel consumption. Uses 2 subplots to plot data separately for petrol consumption versus ce and diesel consumption versus ce. Performs correlation analysis on fuel consumption versus ce for both fuel types. Include axes labels, and a dynamic title that includes the correlation coefficient. (20) Finally, comment on the value of the correlation coefficient in assessing the fuel efficiency i.e. is it a good metric and why? 900 1000 1100 1200 Petrol 4.2 4.88 .01 5.45 Diesel 3.3 3.6 3.6 3.91 2800 2900 3000 8.75 7.88 7.01 8.1 8.19
Step by Step Solution
There are 3 Steps involved in it

Get step-by-step solutions from verified subject matter experts