

Question: (ii) The table below is an extract from an Excel spreadsheet showing weather data per minute for I full day in Dec 2012. BP Time
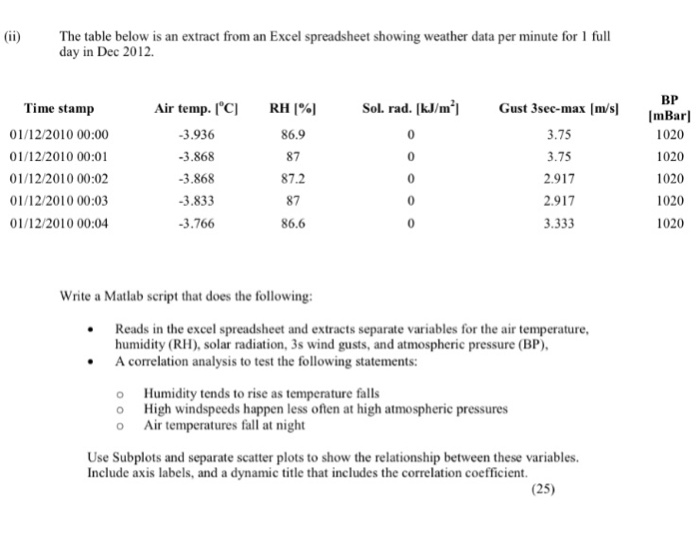
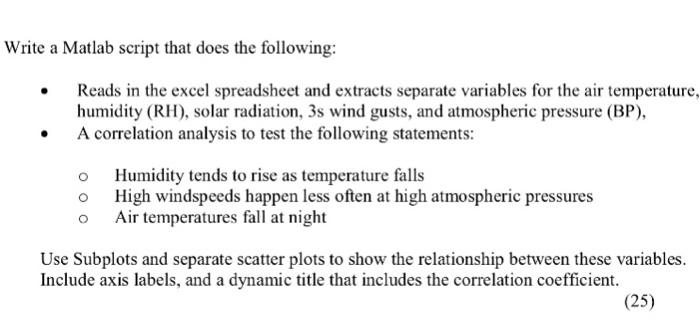
(ii) The table below is an extract from an Excel spreadsheet showing weather data per minute for I full day in Dec 2012. BP Time stamp 01/12/2010 00:00 01/12/2010 00:01 01/12/2010 00:02 01/12/2010 00:03 01/12/2010 00:04 Air temp. rc1 3.936 3.868 3.868 3.833 3.766 RH 1%! 86.9 87 87.2 87 86.6 Sol. rad. [kJ/m l 0 0 0 Gust 3sec-max Im/sl 3.75 3.75 2.917 2.917 3.333 ImBarl 1020 1020 1020 1020 1020 0 Write a Matlab script that does the following Reads in the excel spreadsheet and extracts separate variables for the air temperature, humidity (RH), solar radiation, 3s wind gusts, and atmospheric pressure (BP) A correlation analysis to test the following statements: o Humidity tends to rise as temperature falls o High windspeeds happen less often at high atmospheric pressures o Air temperatures fall at night Use Subplots and separate scatter plots to show the relationship between these variables. Include axis labels, and a dynamic title that includes the correlation coefficient. (25)
Step by Step Solution
There are 3 Steps involved in it

Get step-by-step solutions from verified subject matter experts