

Question: il ili Paragraph 5 Smart Pro Inc. Income Statement compared with Industry Average For the Year Ended December 31, 2020 iPad Industry Products Average Sales
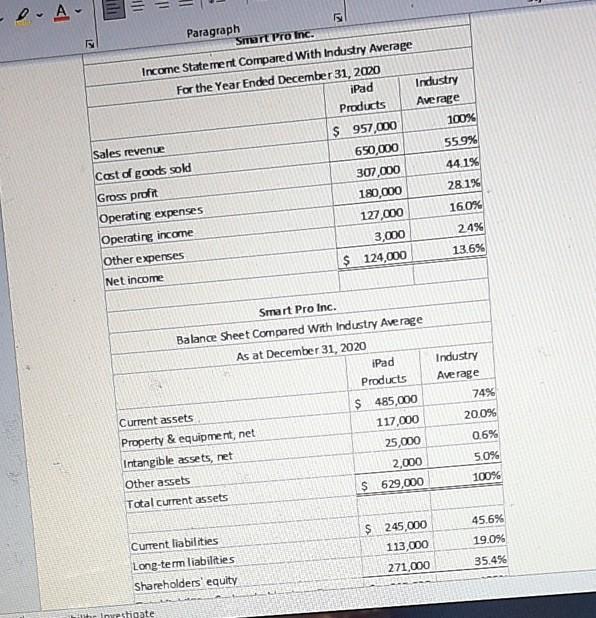
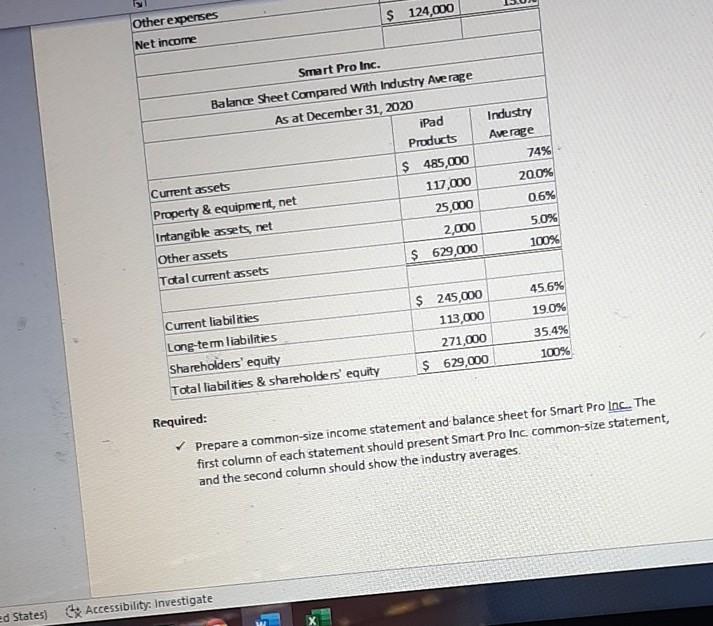
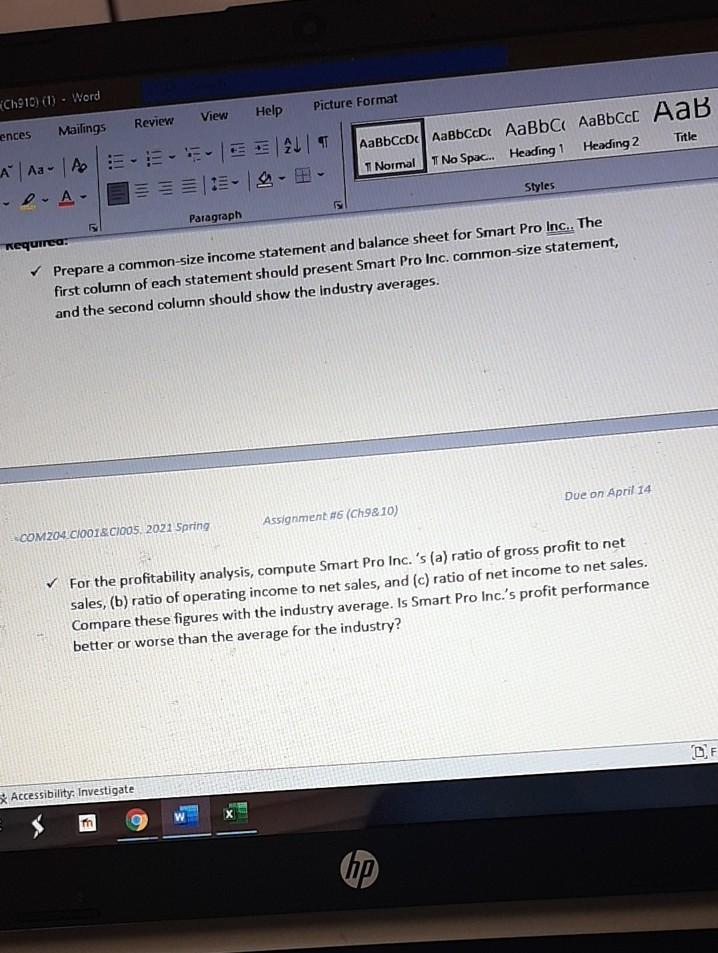
il ili Paragraph 5 Smart Pro Inc. Income Statement compared with Industry Average For the Year Ended December 31, 2020 iPad Industry Products Average Sales revenue S 957,000 100% Cost of goods sold 650,000 559% Gross profit 307,000 44.1% Operating expenses 180,000 28.1% Operating income 127,000 16.0% Other expenses 3,000 24% Net income $ 124,000 13.6% Smart Pro Inc. Balance Sheet Compared with Industry Average As at December 31, 2020 iPad Products Current assets $ 485,000 Property & equipment, net 117,000 Intangible assets, net 25,000 Other assets 2,000 Total current assets $ 629,000 Industry Average 74% 20.0% 0.6% 50% 100% $ 245,000 113,000 45.6% 19.0% Current liabilities Long-term liabilities Shareholders' equity 35.4% 271,000 Silit Imustigate $ 124,000 Other expenses Net income Industry Average 74% 20.0% Smart Pro Inc. Balance Sheet Compared with Industry Average As at December 31, 2020 iPad Products Current assets $ 485,000 Property & equipment, net 117,000 Intangible assets, net 25,000 Other assets 2,000 Total current assets $ 629,000 0.6% 50% 100% Current liabilities $ 245,000 45.6% Long-term liabilities 113,000 19.0% Shareholders' equity 271,000 35.4% Total liabilities & shareholders equity $ 629,000 100% Required: Prepare a common-size income statement and balance sheet for Smart Pro Inc. The first column of each statement should present Smart Pro Inc common-size statement, and the second column should show the industry averages. ed States) Accessibility: Investigate (Ch910) (1) - Word ences Mailings Review View Help Picture Format A Aa A E-SEALT T Normal -e-A- T No Spac... Heading 1 Title Heading 2 Paragraph Styles Requirea: Prepare a common-size income statement and balance sheet for Smart Pro Inc.. The first column of each statement should present Smart Pro Inc. common-size statement, and the second column should show the industry averages. Due on April 14 Assignment #6 (Ch9810) -.COMZ04_C1001&C1005 2021 Spring For the profitability analysis, compute Smart Pro Inc.'s (a) ratio of gross profit to net sales, (b) ratio of operating income to net sales, and (c) ratio of net income to net sales. Compare these figures with the industry average. Is Smart Pro Inc.'s profit performance better or worse than the average for the industry? CF Accessibility. Investigate Op
Step by Step Solution
There are 3 Steps involved in it

Get step-by-step solutions from verified subject matter experts