

Question: Ill Chrome - MyStatLab Data Set statcrunch.com/app/?dlim=comma&dataurl=https://xlitemprod.pearsoncmg.com/GetPlayerFile.ashx?guid=0d2c68d3-d194-4162-96d1-8d183c288ea9&ft=false P StatCrunch ? kda2123@jagmail.southalaba... MyStatLab Data Set StatCrunch * Applets Edit - Data Stat - Graph - Help
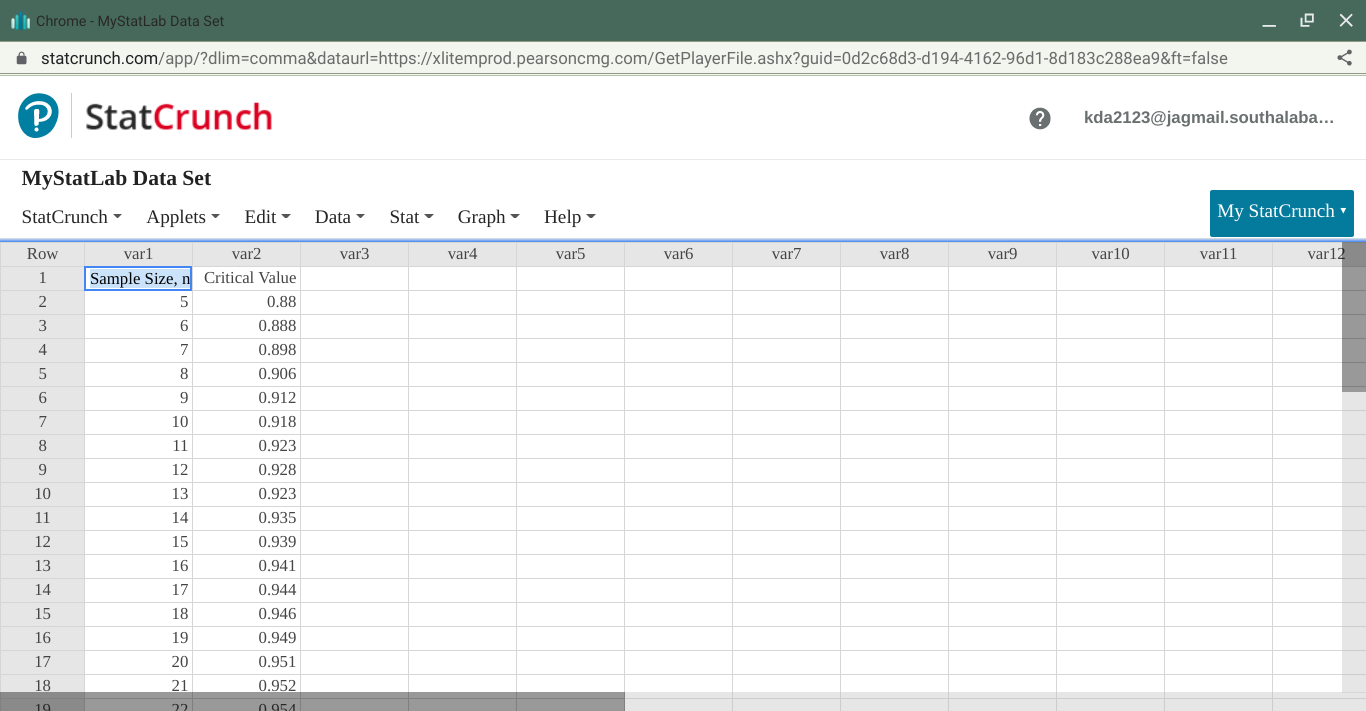
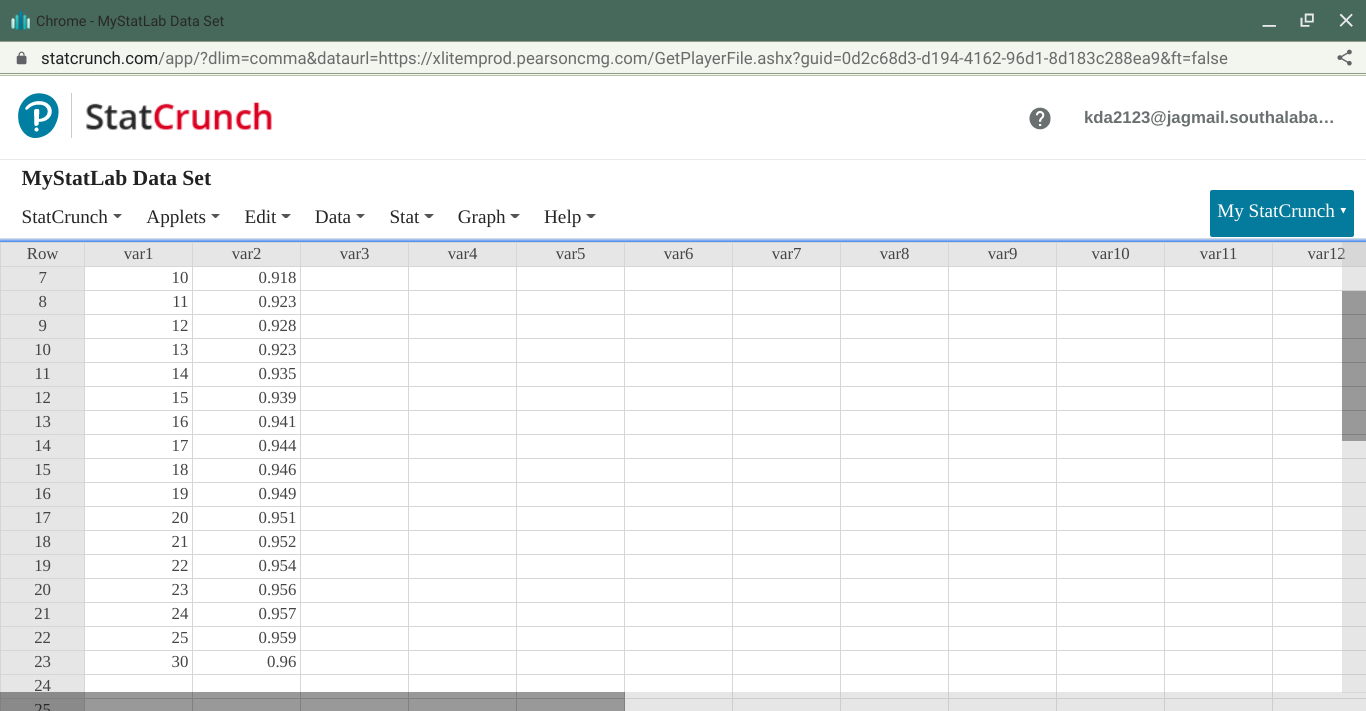
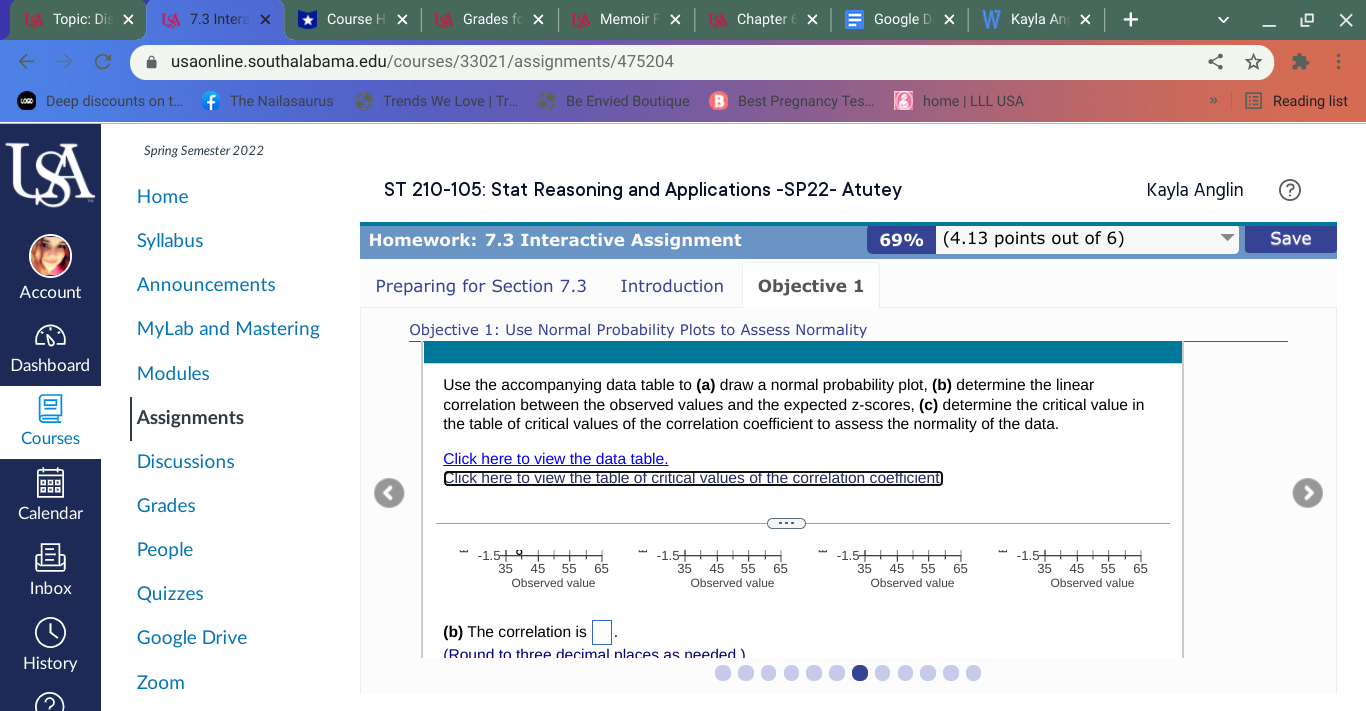
Ill Chrome - MyStatLab Data Set statcrunch.com/app/?dlim=comma&dataurl=https://xlitemprod.pearsoncmg.com/GetPlayerFile.ashx?guid=0d2c68d3-d194-4162-96d1-8d183c288ea9&ft=false P StatCrunch ? kda2123@jagmail.southalaba... MyStatLab Data Set StatCrunch * Applets Edit - Data Stat - Graph - Help My StatCrunch Row var var2 var3 var4 var5 var6 var7 var8 var9 var10 var11 var12 1 Sample Size, n Critical Value 2 5 0.88 W 6 0.888 7 0.898 8 0.906 9 0.912 10 0.918 11 0.923 12 0.928 13 0.923 14 0.935 15 0.939 16 0.941 14 17 0.944 15 18 0.946 16 19 0.949 17 20 0.951 18 21 0.952Ill Chrome - MyStatLab Data Set statcrunch.com/app/?dlim=comma&dataurl=https://xlitemprod.pearsoncmg.com/GetPlayerFile.ashx?guid=0d2c68d3-d194-4162-96d1-8d183c288ea9&ft=false P StatCrunch ? kda2123@jagmail.southalaba... MyStatLab Data Set StatCrunch * Applets Edit - Data Stat - Graph - Help My StatCrunch Row var1 var2 var3 var4 var5 var6 var7 var8 var9 var10 var11 var12 7 10 0.918 8 11 0.923 9 12 0.928 10 13 0.923 11 14 0.935 12 15 0.939 13 16 0.941 14 17 0.944 15 18 0.946 16 19 0.949 17 20 0.951 18 21 0.952 19 22 0.954 20 23 0.956 21 24 0.957 22 25 0.959 23 30 0.96 24Is Topic: Dis X IS1 7.3 Intera X *Course H X ISA Grades fo X IS) Memoir F X IsA Chapter 6 X Google D X W Kayla An X + X C usaonline.southalabama.edu/courses/33021/assignments/475204 . . . was Deep discounts on t.. f The Nailasaurus ) Trends We Love | Tr... ) Be Envied Boutique B Best Pregnancy Tes.. home | LLL USA Reading list Spring Semester 2022 Home ST 210-105: Stat Reasoning and Applications -SP22- Atutey Kayla Anglin (? Syllabus Homework: 7.3 Interactive Assignment 69% (4.13 points out of 6) Save Account Announcements Preparing for Section 7.3 Introduction Objective 1 MyLab and Mastering Objective 1: Use Normal Probability Plots to Assess Normality Dashboard Modules Use the accompanying data table to (a) draw a normal probability plot, (b) determine the linear 2 correlation between the observed values and the expected z-scores, (c) determine the critical value in Assignments the table of critical values of the correlation coefficient to assess the normality of the data. Courses Discussions Click here to view the data table. Click here to view the table of critical values of the correlation coefficient
Step by Step Solution
There are 3 Steps involved in it

Get step-by-step solutions from verified subject matter experts