

Question: Illucard! Why do the hypotheses differ Month 1 2 3 1.4% 2.3% 4.6% 1.3% 2.1% 4.2% 1.1% 2.0% 3.7% 1.0% 1.8% 3.4% 2.7% 3.2% 2.9%
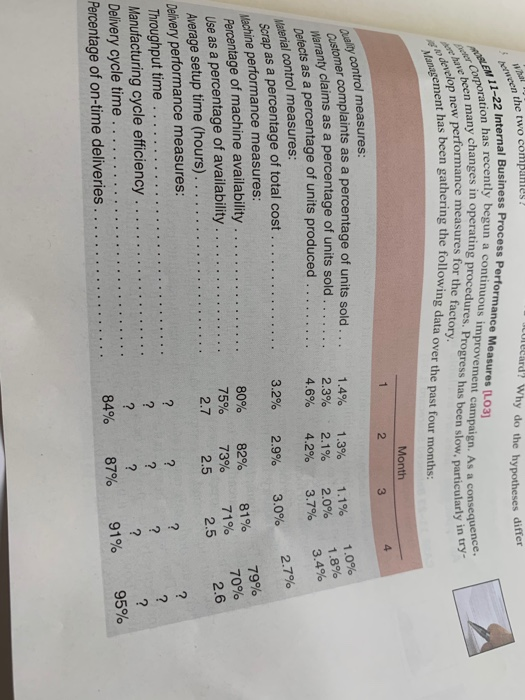
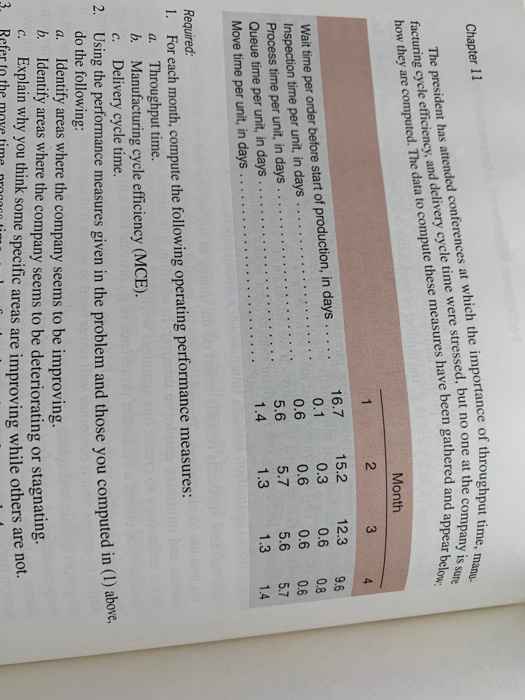
Illucard! Why do the hypotheses differ Month 1 2 3 1.4% 2.3% 4.6% 1.3% 2.1% 4.2% 1.1% 2.0% 3.7% 1.0% 1.8% 3.4% 2.7% 3.2% 2.9% 3.0% 80% 75% 2.7 82% 73% 2.5 81% 71% 2.5 79% 70% 2.6 Scrap as a percentage of total cost. Machine performance measures: Percentage of machine availability. Use as a percentage of availability. Average setup time (hours). Delivery performance measures: Throughput time Manufacturing cycle efficiency Delivery cycle time.... Percentage of on-time deliveries ? ? ? ? ? ? . . . . ? ? 95% ? 84% 87% 91% Awaren the two companies? er Corporation has recently begun a continuous improvement campaign. As a consequence, EN 11-22 Internal Business Process Performance Measures ILO31 Ane been many changes in operating procedures. Progress has been slow, particularly in try- Management has been gathering the following data over the past four months: ally control measures: Customer complaints as a percentage of units sold .. Warranty claims as a percentage of units sold. Defects as a percentage of units produced . develop new performance measures for the factory. Material control measures: Chapter 11 Month 2 3 4 Wait time per order before start of production, in days Inspection time per unit, in days Process time per unit, in days Queue time per unit, in days Move time per unit, in days 16.7 0.1 0.6 5.6 1.4 15.2 0.3 0.6 5.7 1.3 12.3 0.6 0.6 5.6 1.3 9.6 0.8 0.6 5.7 1.4 a. Required: 1. For each month, compute the following operating performance measures: Throughput time. b. Manufacturing cycle efficiency (MCE). c. Delivery cycle time. 2. Using the performance measures given in the problem and those you computed in (1) above, do the following: a. Identify areas where the company seems to be improving. b. Identify areas where the company seems to be deteriorating or stagnating. c. Explain why you think some specific areas are improving while others are not. 3 Refer to the facturing cycle efficiency, and delivery cycle time were stressed, but no one at the company is sure The president has attended conferences at which the importance of throughput time, mang how they are computed. The data to compute these measures have been gathered and appear below: Illucard! Why do the hypotheses differ Month 1 2 3 1.4% 2.3% 4.6% 1.3% 2.1% 4.2% 1.1% 2.0% 3.7% 1.0% 1.8% 3.4% 2.7% 3.2% 2.9% 3.0% 80% 75% 2.7 82% 73% 2.5 81% 71% 2.5 79% 70% 2.6 Scrap as a percentage of total cost. Machine performance measures: Percentage of machine availability. Use as a percentage of availability. Average setup time (hours). Delivery performance measures: Throughput time Manufacturing cycle efficiency Delivery cycle time.... Percentage of on-time deliveries ? ? ? ? ? ? . . . . ? ? 95% ? 84% 87% 91% Awaren the two companies? er Corporation has recently begun a continuous improvement campaign. As a consequence, EN 11-22 Internal Business Process Performance Measures ILO31 Ane been many changes in operating procedures. Progress has been slow, particularly in try- Management has been gathering the following data over the past four months: ally control measures: Customer complaints as a percentage of units sold .. Warranty claims as a percentage of units sold. Defects as a percentage of units produced . develop new performance measures for the factory. Material control measures: Chapter 11 Month 2 3 4 Wait time per order before start of production, in days Inspection time per unit, in days Process time per unit, in days Queue time per unit, in days Move time per unit, in days 16.7 0.1 0.6 5.6 1.4 15.2 0.3 0.6 5.7 1.3 12.3 0.6 0.6 5.6 1.3 9.6 0.8 0.6 5.7 1.4 a. Required: 1. For each month, compute the following operating performance measures: Throughput time. b. Manufacturing cycle efficiency (MCE). c. Delivery cycle time. 2. Using the performance measures given in the problem and those you computed in (1) above, do the following: a. Identify areas where the company seems to be improving. b. Identify areas where the company seems to be deteriorating or stagnating. c. Explain why you think some specific areas are improving while others are not. 3 Refer to the facturing cycle efficiency, and delivery cycle time were stressed, but no one at the company is sure The president has attended conferences at which the importance of throughput time, mang how they are computed. The data to compute these measures have been gathered and appear below
Step by Step Solution
There are 3 Steps involved in it

Get step-by-step solutions from verified subject matter experts