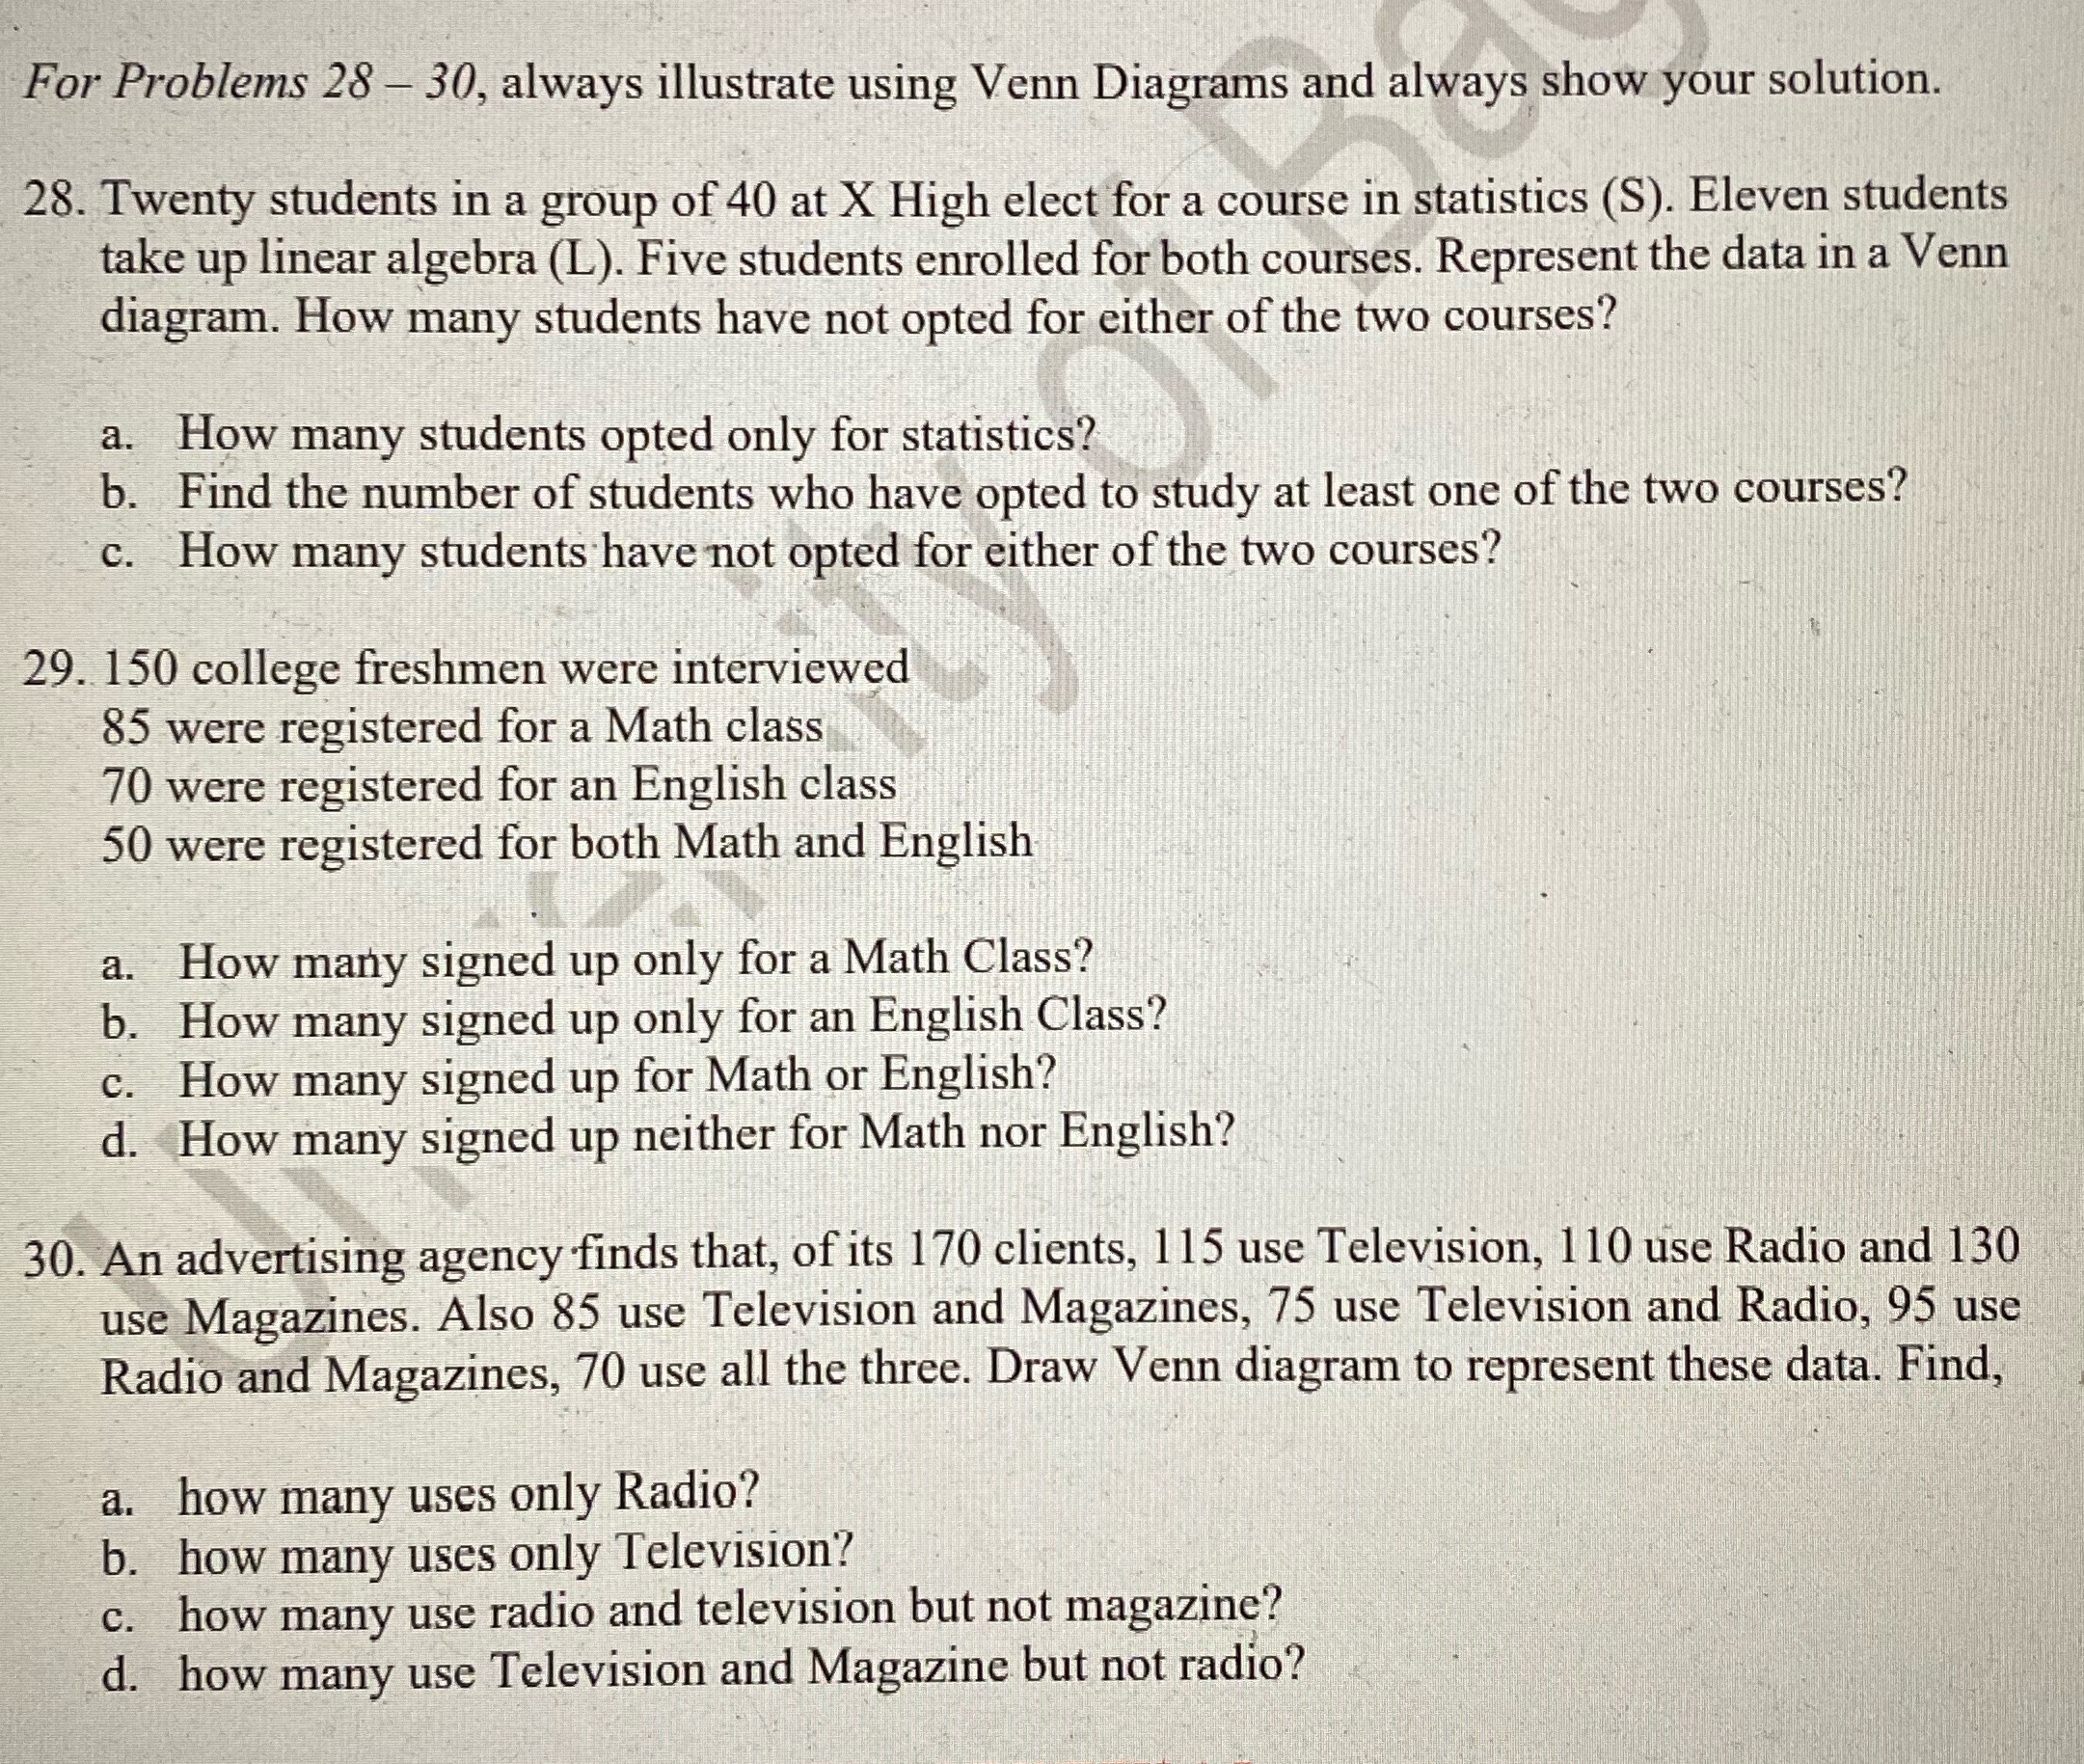
Question: Illustrat using ven diagram and show solutions For Problems 28 - 30, always illustrate using Venn Diagrams and always show your solution. 28. Twenty students

Illustrat using ven diagram and show solutions

Illustrat using ven diagram and show solutions
For Problems 28 - 30, always illustrate using Venn Diagrams and always show your solution. 28. Twenty students in a group of 40 at X High elect for a course in statistics (S). Eleven students take up linear algebra (L). Five students enrolled for both courses. Represent the data in a Venn diagram. How many students have not opted for either of the two courses? a. How many students opted only for statistics? b. Find the number of students who have opted to study at least one of the two courses? c. How many students have not opted for either of the two courses? 29. 150 college freshmen were interviewed 85 were registered for a Math class 70 were registered for an English class 50 were registered for both Math and English a. How many signed up only for a Math Class? b. How many signed up only for an English Class? c. How many signed up for Math or English? d. How many signed up neither for Math nor English? 30. An advertising agency finds that, of its 170 clients, 115 use Television, 110 use Radio and 130 use Magazines. Also 85 use Television and Magazines, 75 use Television and Radio, 95 use Radio and Magazines, 70 use all the three. Draw Venn diagram to represent these data. Find, a. how many uses only Radio? b. how many uses only Television? c. how many use radio and television but not magazine? d. how many use Television and Magazine but not radio

Step by Step Solution

There are 3 Steps involved in it

1 Expert Approved Answer
Step: 1 Unlock blur-text-image
Question Has Been Solved by an Expert!

Get step-by-step solutions from verified subject matter experts

Step: 2 Unlock
Step: 3 Unlock

Students Have Also Explored These Related Mathematics Questions!