

Question: Im an having difficulty setting up the question; any help would be appreciated Boris has a monthly net income and consumes two goods: Housing (H,
Im an having difficulty setting up the question; any help would be appreciated
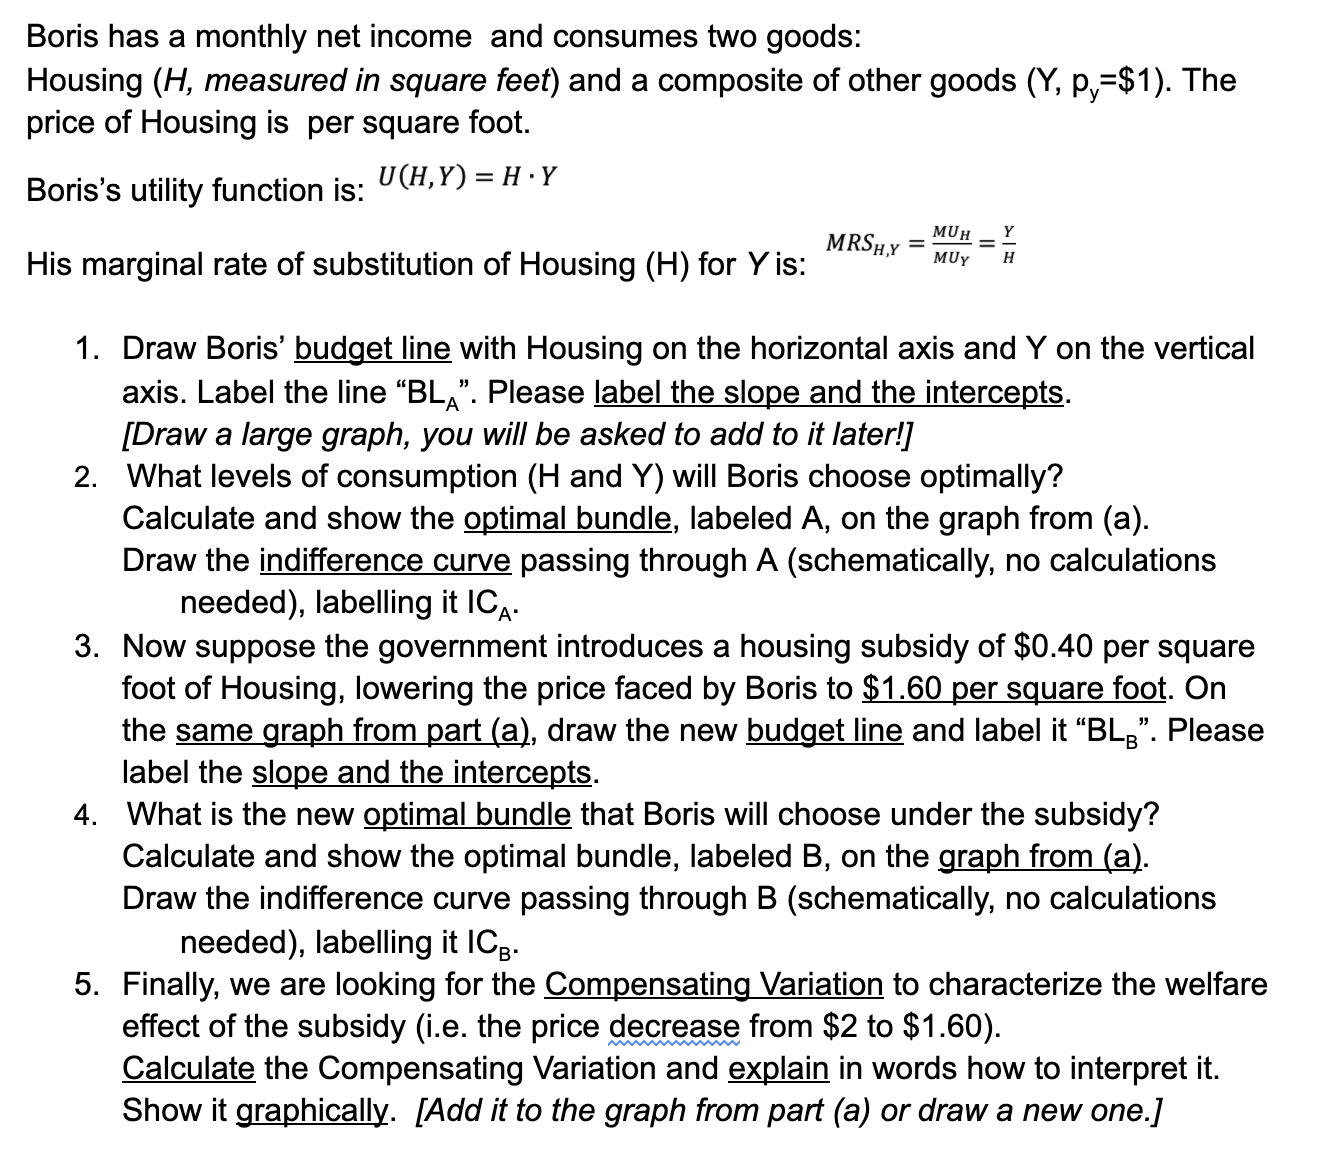
Boris has a monthly net income and consumes two goods: Housing (H, measured in square feet) and a composite of other goods (Y, py=$1). The price of Housing is per square foot. Boris's utility function is: His marginal rate of substitution of Housing (H) for Yis: 1. U(H,Y)=H-Y MRS\" = _ MUy Draw Boris' budget line with Housing on the horizontal axis and Y on the vertical axis. Label the line \"BLA". Please label the slope and the intercepts. [Draw a large graph, you will be asked to add to it later!] What levels of consumption (H and Y) will Boris choose optimally? Calculate and show the optimal bundle, labeled A, on the graph from (a). Draw the indifference curve passing through A (schematically, no calculations needed), labelling it ICA. Now suppose the government introduces a housing subsidy of $0.40 per square foot of Housing, lowering the price faced by Boris to $1.60 per square foot. On the same graph from part (a), draw the new budget line and label it \"BLB\". Please label the slope and the intercepts. What is the new optimal bundle that Boris will choose under the subsidy? Calculate and show the optimal bundle, labeled B, on the graph from (a). Draw the indifference curve passing through B (schematically, no calculations needed), labelling it ICB. Finally, we are looking for the Compensating Variation to characterize the welfare effect of the subsidy (i.e. the price decrease from $2 to $1.60). Calculate the Compensating Variation and explain in words how to interpret it. Show it graphically. [Add it to the graph from part (a) or draw a new one. J
Step by Step Solution
There are 3 Steps involved in it

Get step-by-step solutions from verified subject matter experts