

Question: I'm doing a bivariate regression analysis in my statistics class and I'm a little confused about what all I need to put in a table
I'm doing a bivariate regression analysis in my statistics class and I'm a little confused about what all I need to put in a table in MS word to work on this project. I'm required to put together a table in MS word reflecting data from this image but I am unsure of what I need to put into the table for this section. I am also a bit confused about how to answer the questions by using the data. If someone could explain this to me I would greatly appreciate it!
The hypothesis and questions I need to answer:
Ha1: In comparing individuals, those with more income (income) will have a less favorable view of Christian Fundamentalists (V162095) those with less income.
a) What is the direction of effect? Is it consistent with or contrary to the hypothesis? b) What is the magnitude of effect, if any? c) What is the strength of the relationship (i.e. the association), if any? d) Do you accept or reject the hypothesis? How confident are you (i.e. what is the p-value)? e) Draw a substantive conclusion about the relationship between the two variables.
The data I need to use/turn into a table in MS word:
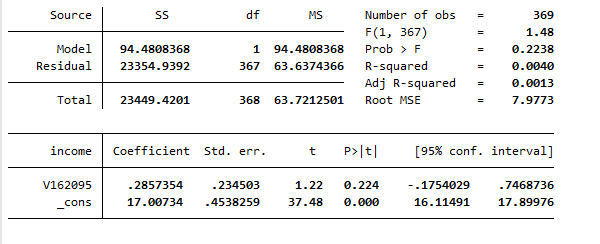
Source SS df MS Number of obs = 369 F (1, 367) 1.48 Model 94. 4808368 1 94.4808368 Prob > F 0.2238 I Residual 23354.9392 367 63.6374366 R-squared 0. 0040 Adj R-squared = 0.0013 Total 23449 . 4201 368 63.7212501 Root MSE 7.9773 income Coefficient Std. err. t P> t [95% conf. interval] V162095 .2857354 .234503 1.22 0.224 - .1754029 .7468736 Cons 17 .00734 . 4538259 37.48 0.000 16.11491 17.89976
Step by Step Solution
There are 3 Steps involved in it

Get step-by-step solutions from verified subject matter experts