

Question: I'm doing a bivariate regression analysis in my statistics class and I'm a little confused about what all I need to put in a table
I'm doing a bivariate regression analysis in my statistics class and I'm a little confused about what all I need to put in a table in MS word to work on this project. I'm required to put together a table in MS word reflecting data from this image but I am unsure of what I need to put into the table to complete this section. I am also a bit confused about how to answer the questions by using the data. If someone could explain this to me I would greatly appreciate it!
My data:
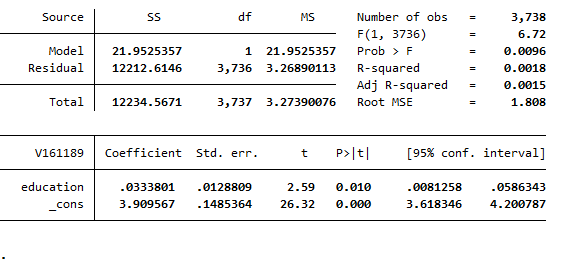
Source SS df MS Number of obs S 3,738 F(1, 3736) 6.72 Model 21.9525357 1 21.9525357 Prob > F = 0. 0096 Residual 12212.6146 3,736 3.26890113 R-squared 0. 0018 Adj R-squared 0. 0015 Total 12234.5671 3,737 3.27390076 Root MSE 1.808 V161189 Coefficient Std. err. t P> t [95% conf. interval] education .0333801 .0128809 2.59 0.010 . 0081258 .0586343 Cons 3.909567 .1485364 26.32 0.000 3.618346 4.200787
Step by Step Solution
There are 3 Steps involved in it

Get step-by-step solutions from verified subject matter experts