

Question: I'm having issues completing the financial statement of ratios chart. please help me understand by showing excel formulas. 1 Ross Stores, Inc. (NMS: ROST) What
I'm having issues completing the financial statement of ratios chart. please help me understand by showing excel formulas.
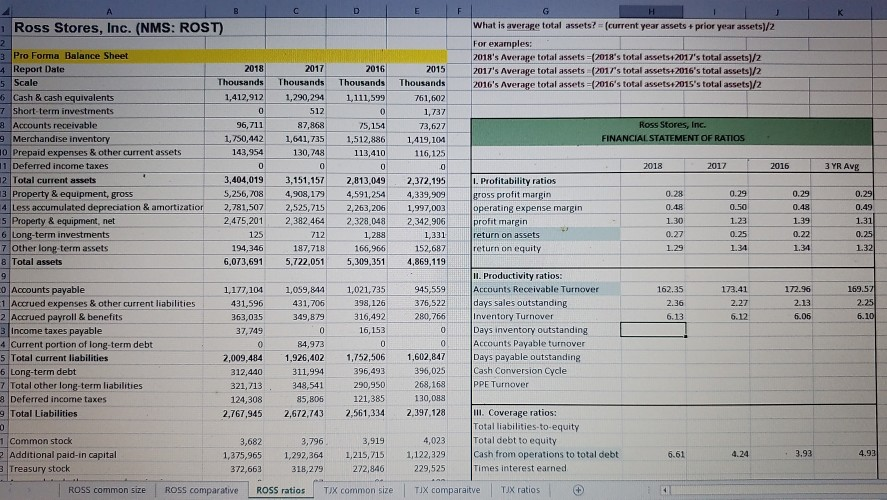
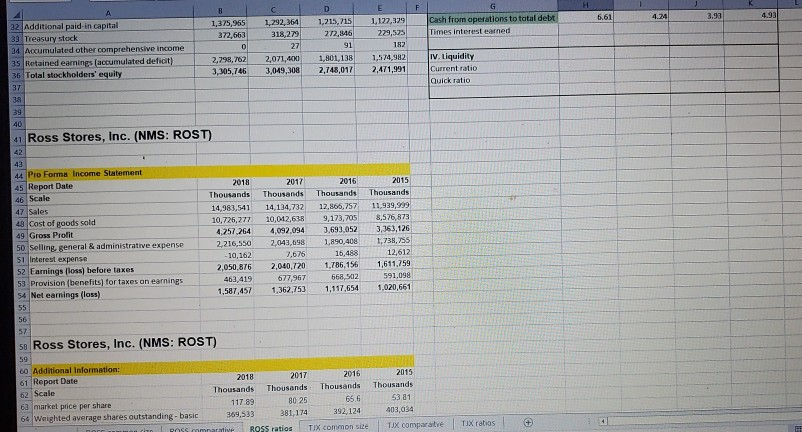
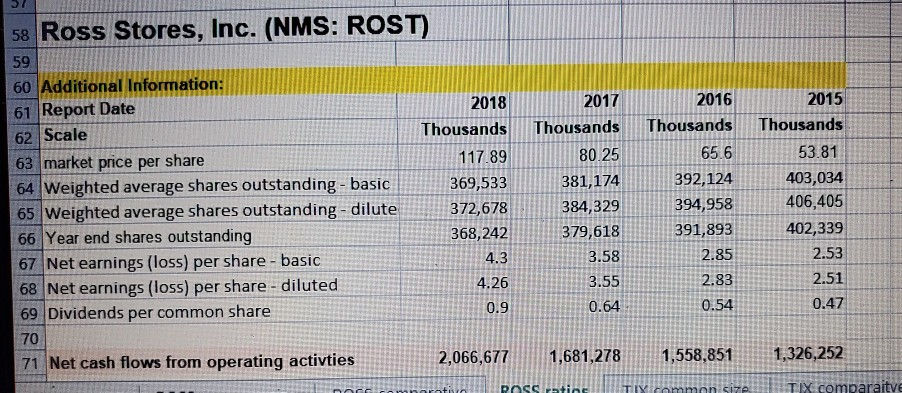
1 Ross Stores, Inc. (NMS: ROST) What is average total assets? (current year assets + prior year assets)/2 For examples: 2018's Average total assets=2018's total assets 2017's total assets)/2 2017's Average total assets (2017's total assets 2016's total assets/2 2016's Average total assets = (2016's total assets 2015's total assets)/2 2018 Thousands 1,412,912 2016 Thousands 1,111,599 2017 Thousands 1,290,294 512 87,868 1,641,735 130,748 Ross Stores, Inc. FINANCIAL STATEMENT OF RATIOS 2018 2017 2015 Thousands 761,602 1,737 73,627 1,419,104 116.125 0 2,372,195 4,339.909 1,997,003 2,342,906 1,331 152,687 4,869,119 2016 3 YR Avg 96,711 1,750,442 143,954 0 3,404,019 5,256,708 2,781,507 2,475,201 125 194,346 6,073,691 75,154 1,512,886 113,410 0 2,813,049 4,591,254 2,263,206 2,328,048 1.288 166,966 5,309,351 0.29 3 Pro Forma Balance Sheet 4 Report Date 5 Scale 5 Cash & cash equivalents 7 Short-term investments 3 Accounts receivable 9 Merchandise inventory 10 Prepaid expenses & other current assets 11 Deferred income taxes 12 Total current assets 13 Property & equipment, gross 4 Less accumulated depreciation & amortizatior 5 Property & equipment, net 6 Long-term investments 7 other long-term assets 8 Total assets 9 0 Accounts payable 1 Accrued expenses & other current liabilities 2 Accrued payroll & benefits 3 Income taxes payable 4 Current portion of long-term debt 5 Total current liabilities 6 Long-term debt 7 Total other long-term liabilities 8 Deferred income taxes 9 Total Liabilities 2 0.49 3,151,157 4,908,179 ,525,715 2,382.464 712 187,718 5,722,051 L. Profitability ratios gross profit margin operating expense margin profit margin return on assets return on equity 0.28 0.48 1.30 0.27 1.29 0.29 0.50 1.23 0.25 1.34 0.29 0.48 1.39 0.22 1.34 1.31 0.25 1.32 1 1,021,735 398, 126 316,492 16,153 162.25 2.36 6.13 173. 41 2.27 6.12 72.96 2.13 6.06 169.57 2.25 6.10 1,177,104 431,596 363,035 37.749 0 2,009,484 312,440 321,713 124,308 2,767,945 1,059,844 431,706 349,879 0 84,973 1,926,402 311,994 348,541 85,806 2.672,743 945,559 376,522 280,766 0 0 1,602,847 396,025 268,168 130,088 2,397,128 11. Productivity ratios: Accounts Receivable Turnover days sales outstanding Inventory Turnover Days inventory outstanding Accounts Payable turnover Days payable outstanding Cash Conversion Cycle PPE Turnover 1,752,506 396,493 290,950 121,385 2,561,334 1 Common stock 2 Additional paid-in capital Treasury stock ROSS common size 3,682 1,375,965 372,663 3,796 1,292,364 318,279 3,919 1,215,715 272,846 4,023 1,122,329 229,525 III. Coverage ratios: Total liabilities-to-equity Total debt to equity Cash from operations to total debt Times interest earned 3.93 ROSS comparative ROSS ratios TIX common size TIX comparaitre TAX ratios 5.61 4.24 1,375,965 372,663 1,292,364 318,279 1,215,715 272,846 Cash from operations to total debt Times interest earned 32 Additional paid in capital 33 Treasury stock 34 Accumulated other comprehensive income 35 Retained earnings accumulated defit 36 Total stockholders' equity 1,177,379 229,525 182 1,574,982 2.471.991 2,798,762 3,305,746 2,071,400 3.049,308 1,801, 138 2.748 017 IV. Liquidity Current ratio Quick ratio 41 Ross Stores, Inc. (NMS: ROST) 44 Pro Forma Income Statement 45 Report Date 46 Scale 47 Sales 48 Cost of goods sold 49 Gross Profit SO Selling general & administrative expense 51 Interest expense 52 Earnings (los) before taxes 53 Provision (benefits) for taxes on earnings 54 Net earnings (loss) 2018 Thousands 14.983,541 10.726,777 4.257 264 2.216,550 -10,162 2,050,876 463,419 1,587,457 2017 Thousands 14,134,732 10,042,6 4,092 094 2,043,698 7,676 2,040,720 677,967 1,362,753 2016 Thousands 12,866,757 9,173,705 3.693 052 1.890,408 16.488 1,786,156 668,502 1,117,654 2015 Thousands 11,939,999 8,576,873 3.363,126 1,738,755 12,612 1,611,759 591,098 1,020,661 se Ross Stores, Inc. (NMS: ROST) Additional Information: 61 Report Date 62 Scale 63 market price per share 64 Weighted average shares outstanding basic 2018 2017 2016 Thousands Thousands Thousands 117.89 80 25 65.6 369,533 3 81,174 392 124 ROSS ratios TX common site 2015 Thousands 53.81 401,034 TX comparate TIX ratios 58 Ross Stores, Inc. (NMS: ROST) 2016 60 Additional Informa 61 Report Date 62 Scale 63 market price per share 64 Weighted average shares outstanding - basic 65 Weighted average shares outstanding - dilute 66 Year end shares outstanding 67 Net earnings (loss) per share - basic 68 Net earnings (loss) per share - diluted 69 Dividends per common share 2018 Thousands 117.89 369,533 372,678 368,242 2017 Thousands 80.25 381,174 384,329 379,618 3.58 Thousands 65.6 392,124 394,958 391,893 2.85 2.83 0.54 2015 Thousands 53.81 403,034 406,405 402,339 2.53 2.51 0.47 3.55 0.64 70 71 Net cash flows from operating activties 2,066,677 1,681,278 1,558,851 1,326,252
Step by Step Solution
There are 3 Steps involved in it

Get step-by-step solutions from verified subject matter experts