

Question: I'm having trouble trying to solve for (e.). ONLY (e.). Please show steps and answer ASAP. Participant 1 2 3 5 6 Blue 0.582 0.481
I'm having trouble trying to solve for (e.). ONLY (e.). Please show steps and answer ASAP.
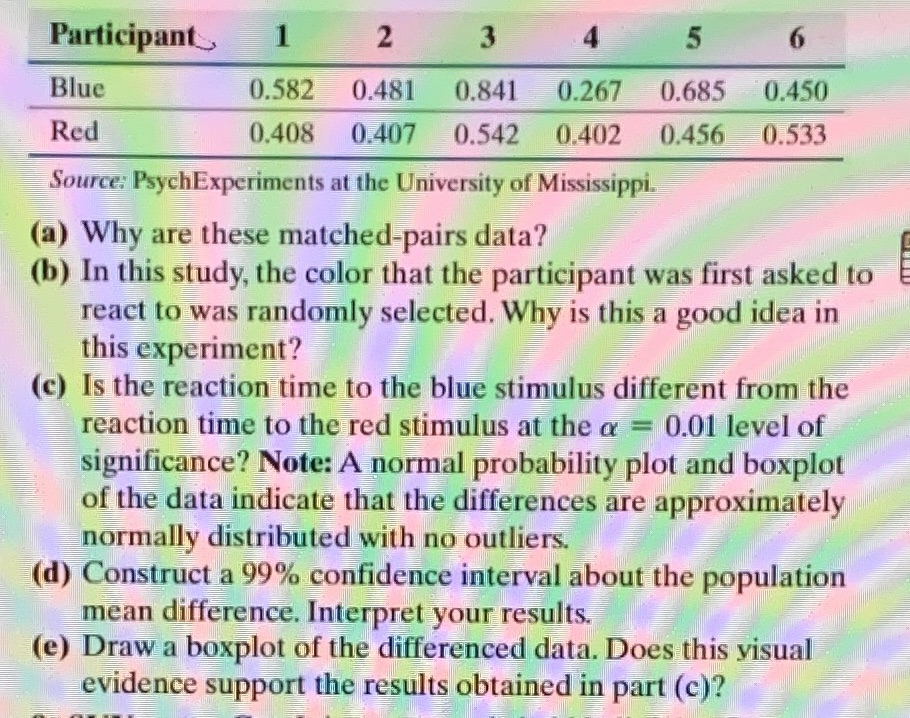
Participant 1 2 3 5 6 Blue 0.582 0.481 0.841 0.267 0.685 0.450 Red 0.408 0.407 0.542 0.402 0.456 0.533 Source: PsychExperiments at the University of Mississippi. (a) Why are these matched-pairs data? (b) In this study, the color that the participant was first asked to react to was randomly selected. Why is this a good idea in this experiment? (c) Is the reaction time to the blue stimulus different from the reaction time to the red stimulus at the or = 0.01 level of significance? Note: A normal probability plot and boxplot of the data indicate that the differences are approximately normally distributed with no outliers. (d) Construct a 99% confidence interval about the population mean difference. Interpret your results. (e) Draw a boxplot of the differenced data. Does this visual evidence support the results obtained in part (c)
Step by Step Solution
There are 3 Steps involved in it

Get step-by-step solutions from verified subject matter experts