

Question: I'm having with my code below. I have to recreate the 3-D plots in Image 1, but my code is producing the plots in Image
I'm having with my code below. I have to recreate the 3-D plots in Image 1, but my code is producing the plots in Image 2, where the fit line is incorrect. Please review my code and explain what I need to correct with the correct code.
CODE IS BELOW
# Common imports from sklearn.linear_model import LinearRegression import matplotlib.pyplot as plt import matplotlib as mpl from matplotlib import cm import numpy as np import pandas as pd import os %matplotlib inline mpl.rc('axes', labelsize=14) mpl.rc('xtick', labelsize=12) mpl.rc('ytick', labelsize=12)
# Where to save the figures PROJECT_ROOT_DIR = "." FOLDER = "figures" IMAGES_PATH = os.path.join(PROJECT_ROOT_DIR, FOLDER) os.makedirs(IMAGES_PATH, exist_ok=True)
def save_fig(fig_id, tight_layout=True, fig_extension="png", resolution=300): path = os.path.join(IMAGES_PATH, fig_id + "." + fig_extension) print("Saving figure", fig_id) if tight_layout: plt.tight_layout() plt.savefig(path, format=fig_extension, dpi=resolution)
import pandas as pd
fileName = "PolynomialRegressionData_I.csv"
#Import data into dataframe data = pd.read_csv(fileName)
#Assign data for x, y, and z scatter plots xdata = data["x"] ydata = data["y"] zdata = data["z"]
#Perform a polynomial transformation on your feature
#Reshaping Pandas Series to a 2-D array to enable model fit to work x = np.array(xdata).reshape(-1,1) y = np.array(ydata).reshape(-1,1) z = np.array(zdata).reshape(-1,1)
from sklearn.preprocessing import PolynomialFeatures
# Create a PolynomialFeatures object with the desired degree poly = PolynomialFeatures(degree=2, include_bias = False)
# Transform the input features into polynomial features X_poly = poly.fit_transform(x)
# Create a LinearRegression object and fit it to the transformed data model = LinearRegression() model.fit(X_poly, y)
# Plot Curve Fit x_fit = np.linspace(-21,21,1000) y_fit = x_fit
#Combining x_fit and y_fit together x1Y1 = np.column_stack((x_fit, y_fit)) x1Y1
# Create z_fit line using model predict z_fit = model. Predict(x1Y1)
#Must reshape z_fit back to 1-D first
z_fit = np.array(z_fit).reshape(1000,)
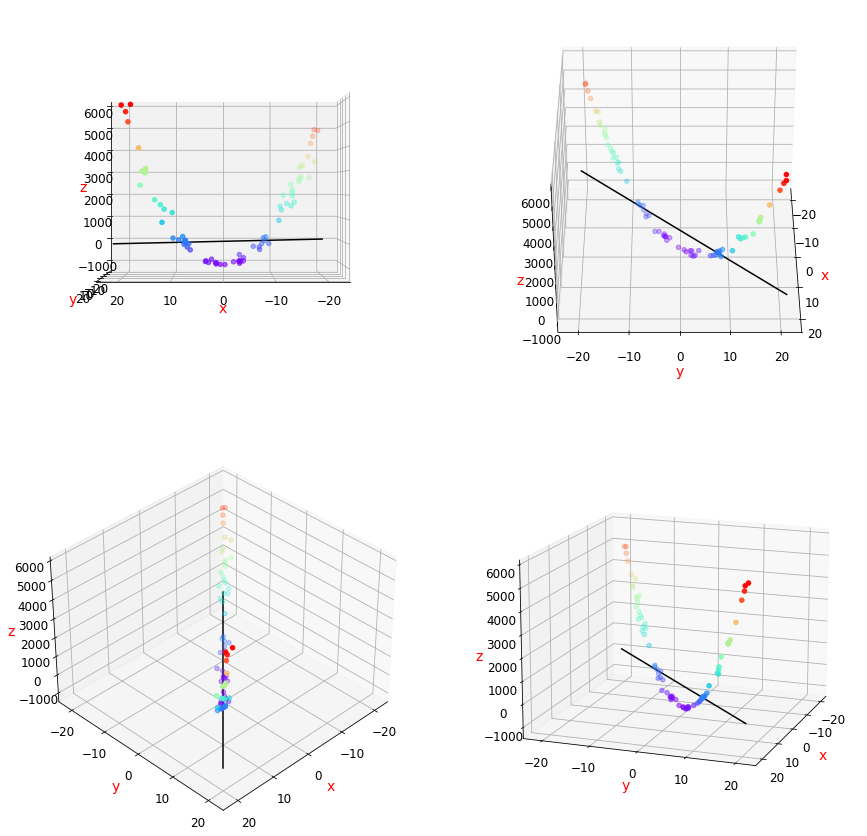
#Creation of Image 2: Same as Image 1 but adding fit lines to scatter plots
fig = plt.figure(figsize = [15,15])
#Setting up scatter axis for subplot 1 axis1 = fig.add_subplot(2, 2, 1, projection = "3d") axis1.view_init(0, 90) axis1.set_xlabel('x', color = "red") axis1.set_ylabel('y', color = "red") axis1.plot3D(x_fit, y_fit, z_fit, "black"); axis1.scatter3D(xdata, ydata, zdata, c = zdata, cmap = "rainbow"); axis1.set_zlabel('z', color = "red");
#Setting up scatter axis for subplot 2 axis2 = fig.add_subplot(2, 2, 2, projection = "3d") axis2.view_init(azim = 0, elev = 36) axis2.set_xlabel('x', color = "red") axis2.set_ylabel('y', color = "red") axis2.plot3D(x_fit, y_fit, z_fit, "black") axis2.set_zlabel('z', color = "red"); axis2.scatter3D(xdata, ydata, zdata, c = zdata, cmap = "rainbow");
#Setting up scatter axis for subplot 3 axis3 = fig.add_subplot(2, 2, 3, projection = "3d") axis3.view_init(azim = 45, elev = 36) axis3.set_xlabel('x', color = "red") axis3.set_ylabel('y', color = "red") axis3.plot3D(x_fit, y_fit, z_fit, "black"); axis3.set_zlabel('z', color = "red"); axis3.scatter3D(xdata, ydata, zdata, c = zdata, cmap = "rainbow");
#Setting up scatter axis for subplot 4 axis4 = fig.add_subplot(2, 2, 4, projection = "3d") axis4.view_init(15, 20) axis4.set_xlabel('x', color = "red") axis4.set_ylabel('y', color = "red") axis4.plot3D(x_fit, y_fit, z_fit, "black"); axis4.set_zlabel('z', color = "red"); axis4.scatter3D(xdata, ydata, zdata, c = zdata, cmap = "rainbow");
Image 1: 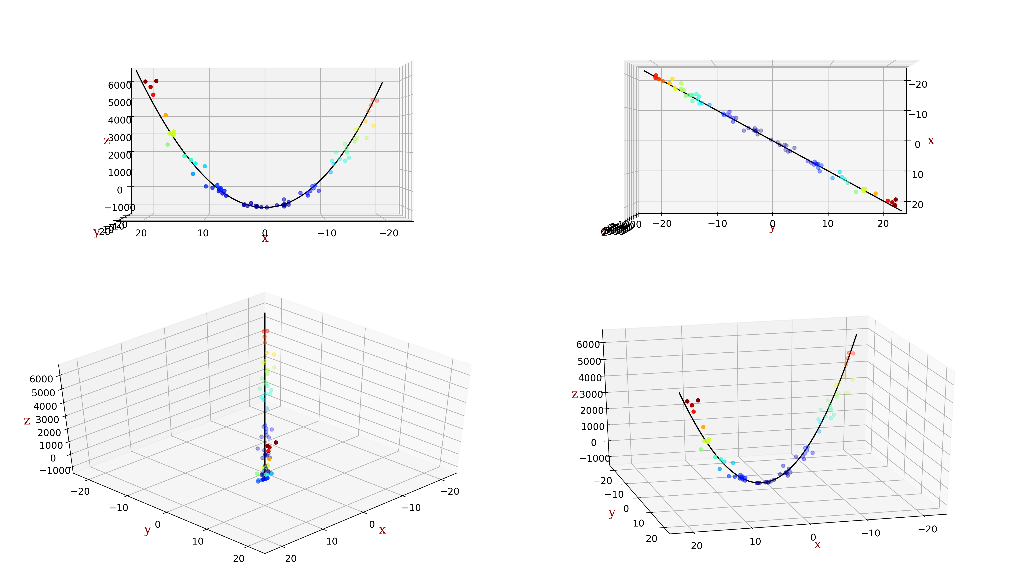
Image 2:
2020
Step by Step Solution
There are 3 Steps involved in it

Get step-by-step solutions from verified subject matter experts