

Question: I'm just having trouble with C Characteristic Line and Security Market Line You are given the following set of data: Historical Rates of Return Year
I'm just having trouble with C
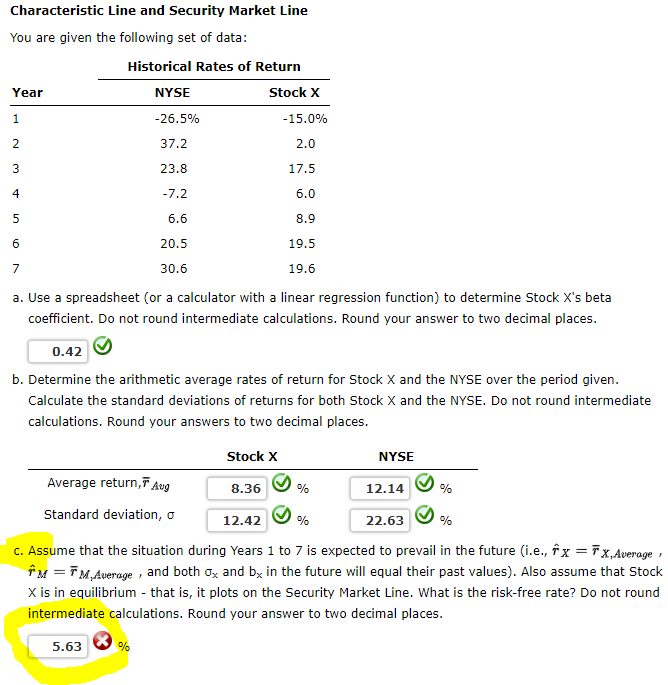
Characteristic Line and Security Market Line You are given the following set of data: Historical Rates of Return Year NYSE Stock X -26.5% - 15.0% 1 2 37.2 2.0 3 23.8 17.5 4 -7.2 6.0 5 6.6 8.9 6 20.5 19.5 7 19.6 30.6 a. Use a spreadsheet (or a calculator with a linear regression function) to determine Stock X's beta coefficient. Do not round intermediate calculations. Round your answer to two decimal places. 0.42 b. Determine the arithmetic average rates of return for Stock X and the NYSE over the period given. Calculate the standard deviations of returns for both Stock X and the NYSE. Do not round intermediate calculations. Round your answers to two decimal places. Stock x NYSE Average return, Aug 8.36 % 12.14 % Standard deviation, o 12.42 % 22.63 % C. Assume that the situation during Years 1 to 7 is expected to prevail in the future (i.e., f x = 1 x Average m=FM Average, and both ox and by in the future will equal their past values). Also assume that Stock X is in equilibrium - that is, it plots on the Security Market Line. What is the risk-free rate? Do not round intermediate calculations. Round your answer to two decimal places. 5.63 %
Step by Step Solution
There are 3 Steps involved in it

Get step-by-step solutions from verified subject matter experts