

Question: I'm really sorry, I thought that when I asked the question the document would automatically attach with here are the screen shots of the box
I'm really sorry, I thought that when I asked the question the document would automatically attach with here are the screen shots of the box on which I asked you the basic question. "Hello! can you help me understand this case? I have some issue with the calculation. I thank you really much in advance" *
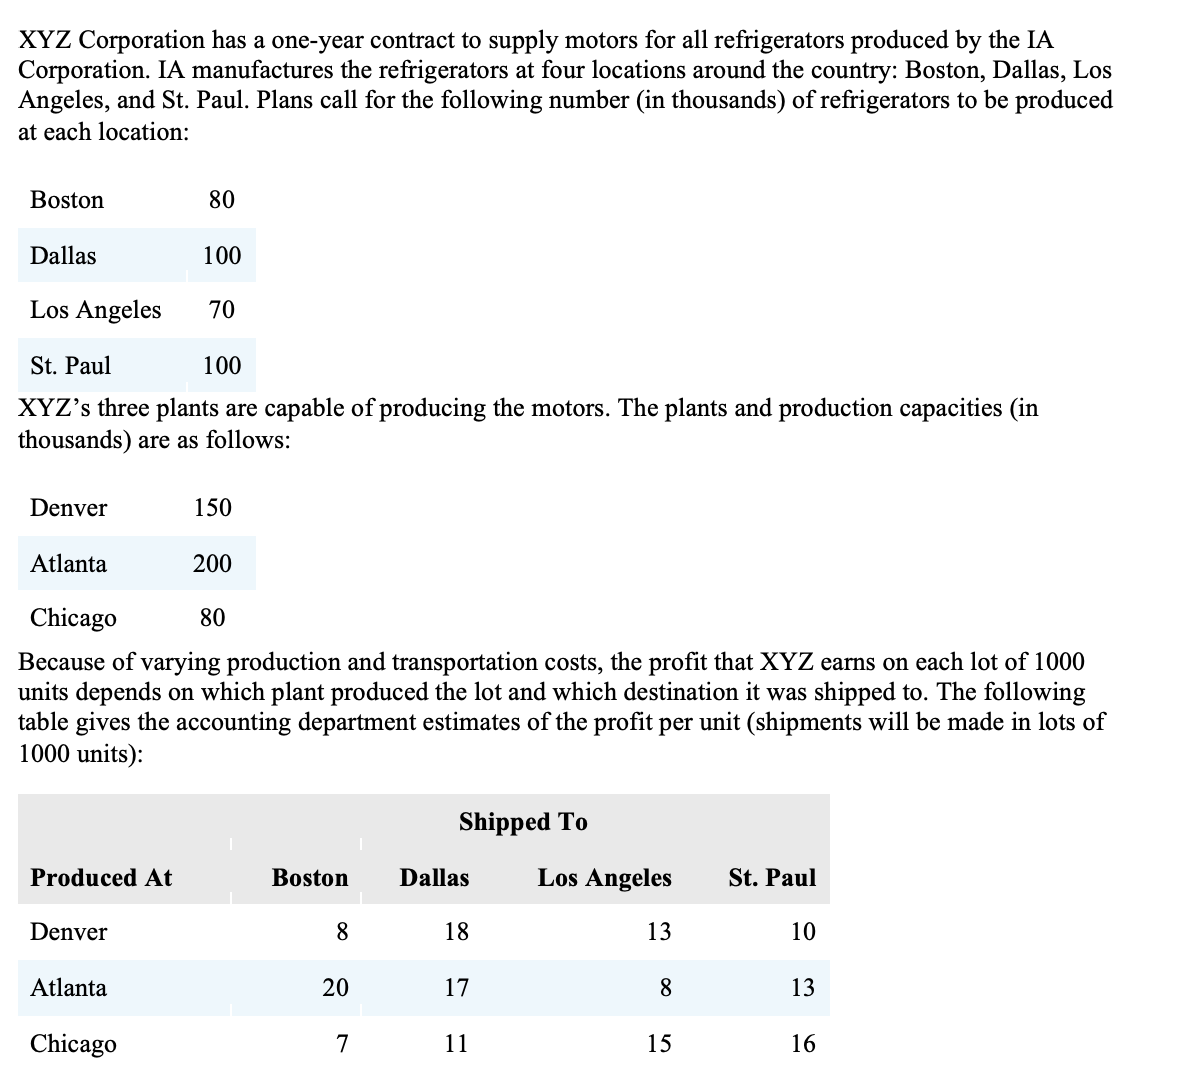
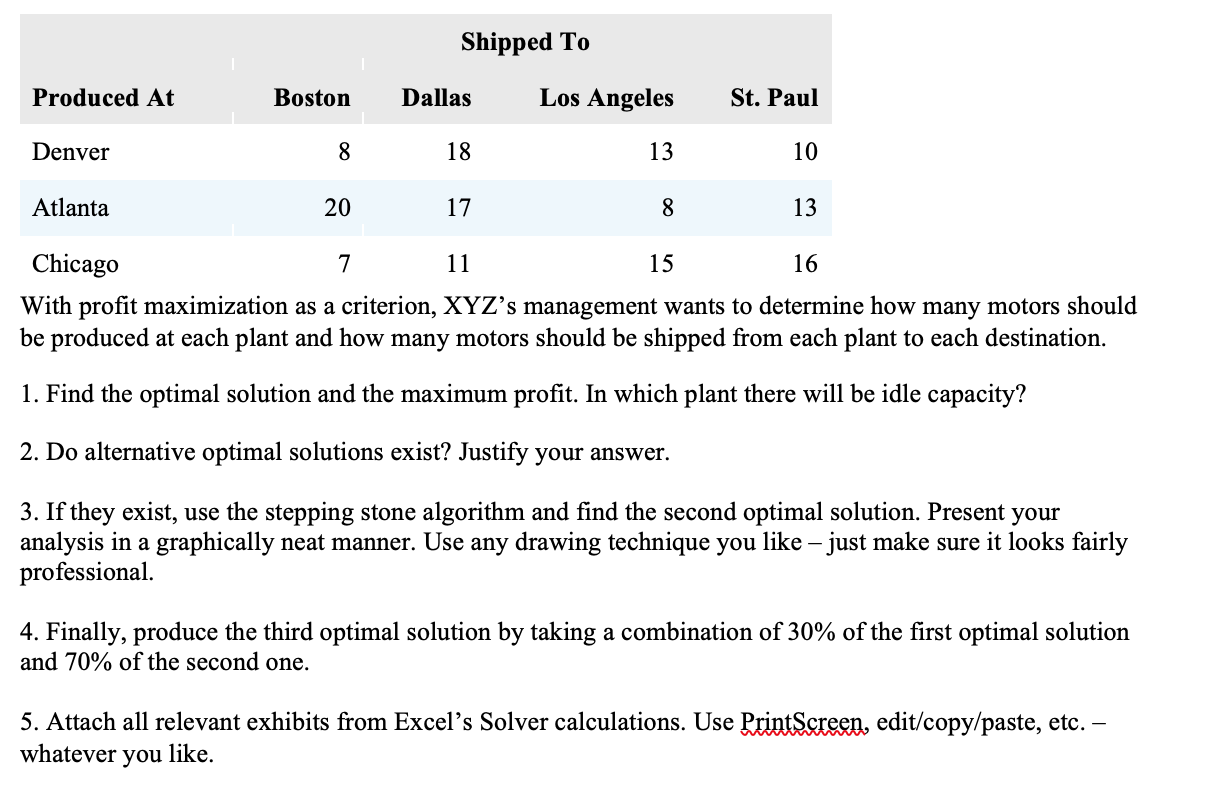
XYZ Corporation has a one-year contract to supply motors for all refrigerators produced by the IA Corporation. IA manufactures the refrigerators at four locations around the country: Boston, Dallas, Los Angeles, and St. Paul. Plans call for the following number (in thousands) of refrigerators to be produced at each location: Boston 80 Dallas 100 Los Angeles 70 St. Paul 100 XYZ's three plants are capable of producing the motors. The plants and production capacities (in thousands) are as follows: Denver 150 Atlanta 200 Chicago 80 Because of varying production and transportation costs, the profit that XYZ earns on each lot of 1000 units depends on which plant produced the lot and which destination it was shipped to. The following table gives the accounting department estimates of the profit per unit (shipments will be made in lots of 1000 units): Shipped To Produced At Boston Dallas Los Angeles St. Paul Denver 8 18 13 10 Atlanta 20 17 8 13 Chicago 7 11 15 16Shipped To Produced At Boston Dallas Los Angeles Denver 8 1 8 1 3 Atlanta 20 17 8 Chicago 7 1 1 15 St. Paul 1 0 1 3 1 6 With prot maximization as a criterion, XYZ's management wants to determine how many motors should be produced at each plant and how many motors should be shipped om each plant to each destination. 1. Find the optimal solution and the maximum prot. In which plant there will be idle capacity? 2. Do alternative optimal solutions exist? Justify your answer. 3. If they exist, use the stepping stone algorithm and nd the second optimal solution. Present your analysis in a graphically neat manner. Use any drawing technique you like just make sure it looks fairly professional. 4. Finally, produce the third optimal solution by taking a combination of 30% of the rst optimal solution and 70% of the second one. 5. Attach all relevant exhibits from Excel's Solver calculations. Use Mm edit/copy/paste, etc. whatever you like
Step by Step Solution
There are 3 Steps involved in it

Get step-by-step solutions from verified subject matter experts