

Question: I'm struggling to answer this excel question. If someone could give me a step by step I would really appreciate it! b) SHM Hotel Revenue
I'm struggling to answer this excel question. If someone could give me a step by step I would really appreciate it!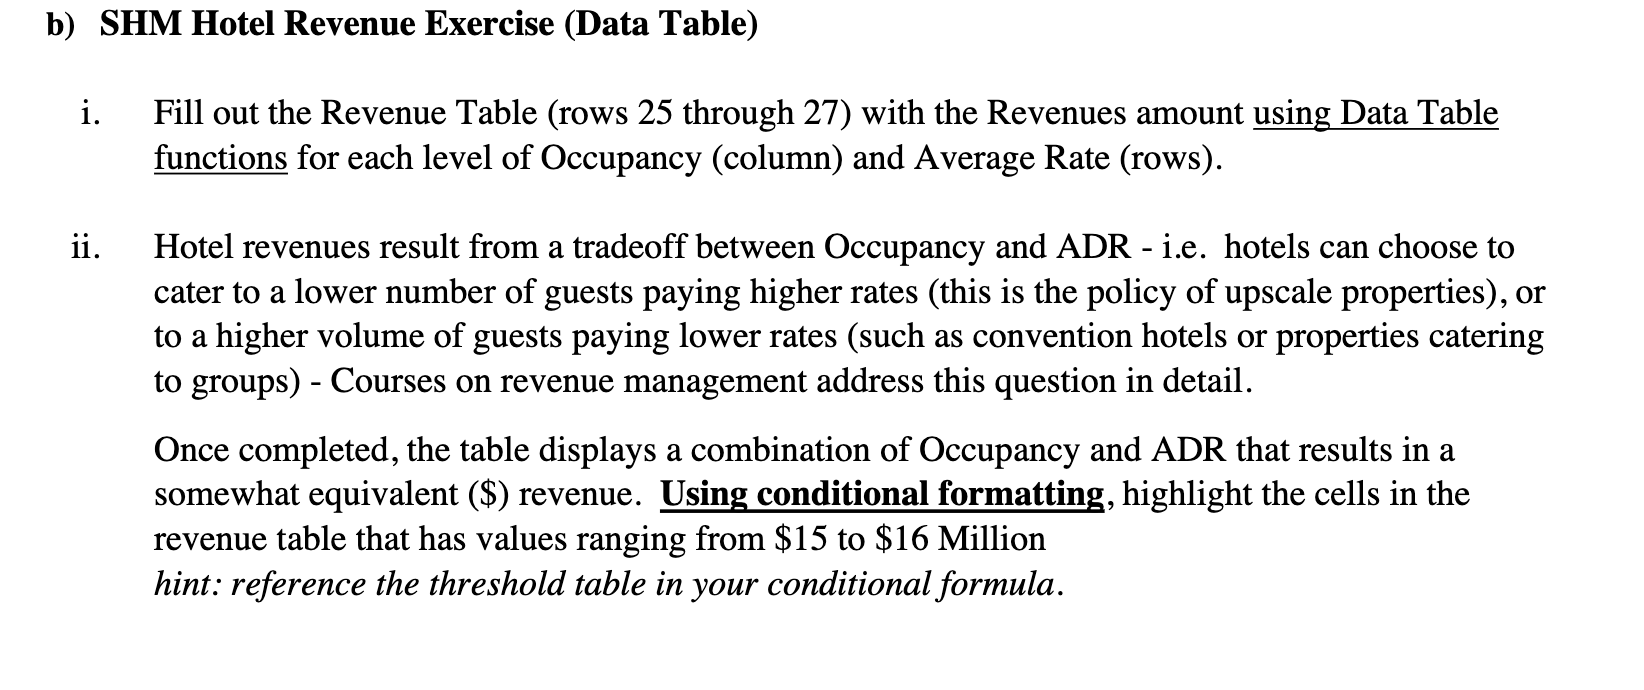
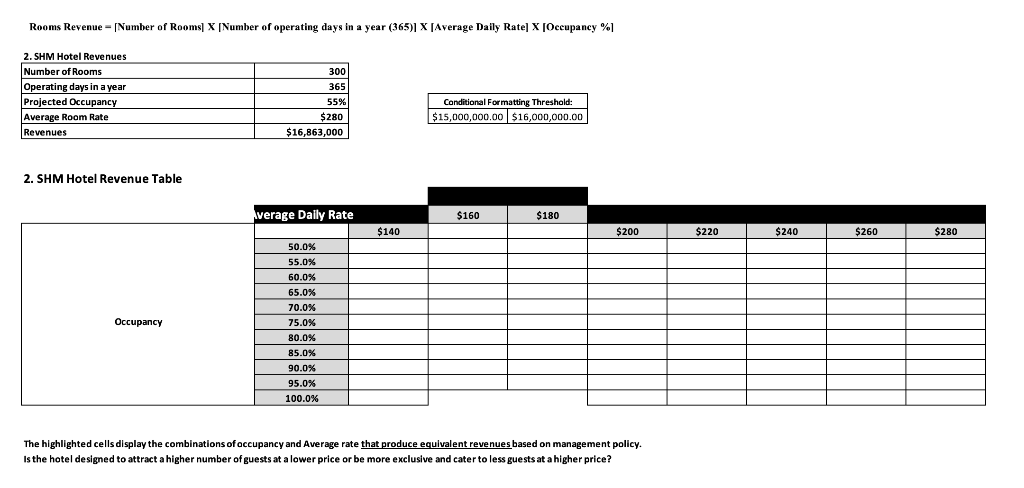
b) SHM Hotel Revenue Exercise (Data Table) i. Fill out the Revenue Table (rows 25 through 27) with the Revenues amount using Data Table functions for each level of Occupancy (column) and Average Rate (rows). ii. Hotel revenues result from a tradeoff between Occupancy and ADR - i.e. hotels can choose to cater to a lower number of guests paying higher rates (this is the policy of upscale properties), or to a higher volume of guests paying lower rates (such as convention hotels or properties catering to groups) - Courses on revenue management address this question in detail. Once completed, the table displays a combination of Occupancy and ADR that results in a somewhat equivalent ($) revenue. Using conditional formatting, highlight the cells in the revenue table that has values ranging from $15 to $16 Million hint: reference the threshold table in your conditional formula. Rooms Revenue - [Number of Rooms] x [Number of operating days in a year (365)] x [Average Daily Rate] x [Occupancy % 2. SHM Hotel Revenues Number of Rooms Operating days in a year Projected Occupancy Average Room Rate Revenues 300 365 55% $280 $16,863,000 Conditional Formatting Threshold: $15,000,000.00 $16,000,000.00 2. SHM Hotel Revenue Table Average Daily Rate $160 $180 $140 $200 $220 $240 $260 $280 50.0% 55.0% 60.0% 65.0% 70.0% 75.0% Occupancy 80.0% 85.0% 90.0% 95.0% 100.0% The highlighted cells display the combinations of occupancy and Average rate that produce equivalent revenues based on management policy. Is the hotel designed to attract a higher number of guests at a lower price or be more exclusive and cater to less guests at a higher price? b) SHM Hotel Revenue Exercise (Data Table) i. Fill out the Revenue Table (rows 25 through 27) with the Revenues amount using Data Table functions for each level of Occupancy (column) and Average Rate (rows). ii. Hotel revenues result from a tradeoff between Occupancy and ADR - i.e. hotels can choose to cater to a lower number of guests paying higher rates (this is the policy of upscale properties), or to a higher volume of guests paying lower rates (such as convention hotels or properties catering to groups) - Courses on revenue management address this question in detail. Once completed, the table displays a combination of Occupancy and ADR that results in a somewhat equivalent ($) revenue. Using conditional formatting, highlight the cells in the revenue table that has values ranging from $15 to $16 Million hint: reference the threshold table in your conditional formula. Rooms Revenue - [Number of Rooms] x [Number of operating days in a year (365)] x [Average Daily Rate] x [Occupancy % 2. SHM Hotel Revenues Number of Rooms Operating days in a year Projected Occupancy Average Room Rate Revenues 300 365 55% $280 $16,863,000 Conditional Formatting Threshold: $15,000,000.00 $16,000,000.00 2. SHM Hotel Revenue Table Average Daily Rate $160 $180 $140 $200 $220 $240 $260 $280 50.0% 55.0% 60.0% 65.0% 70.0% 75.0% Occupancy 80.0% 85.0% 90.0% 95.0% 100.0% The highlighted cells display the combinations of occupancy and Average rate that produce equivalent revenues based on management policy. Is the hotel designed to attract a higher number of guests at a lower price or be more exclusive and cater to less guests at a higher price
Step by Step Solution
There are 3 Steps involved in it

Get step-by-step solutions from verified subject matter experts