Question: I'm stuck on this question, please help me: harsh winter ranging from 0.2 to 0.8 in increments of - A hardware store must decide how
I'm stuck on this question, please help me:
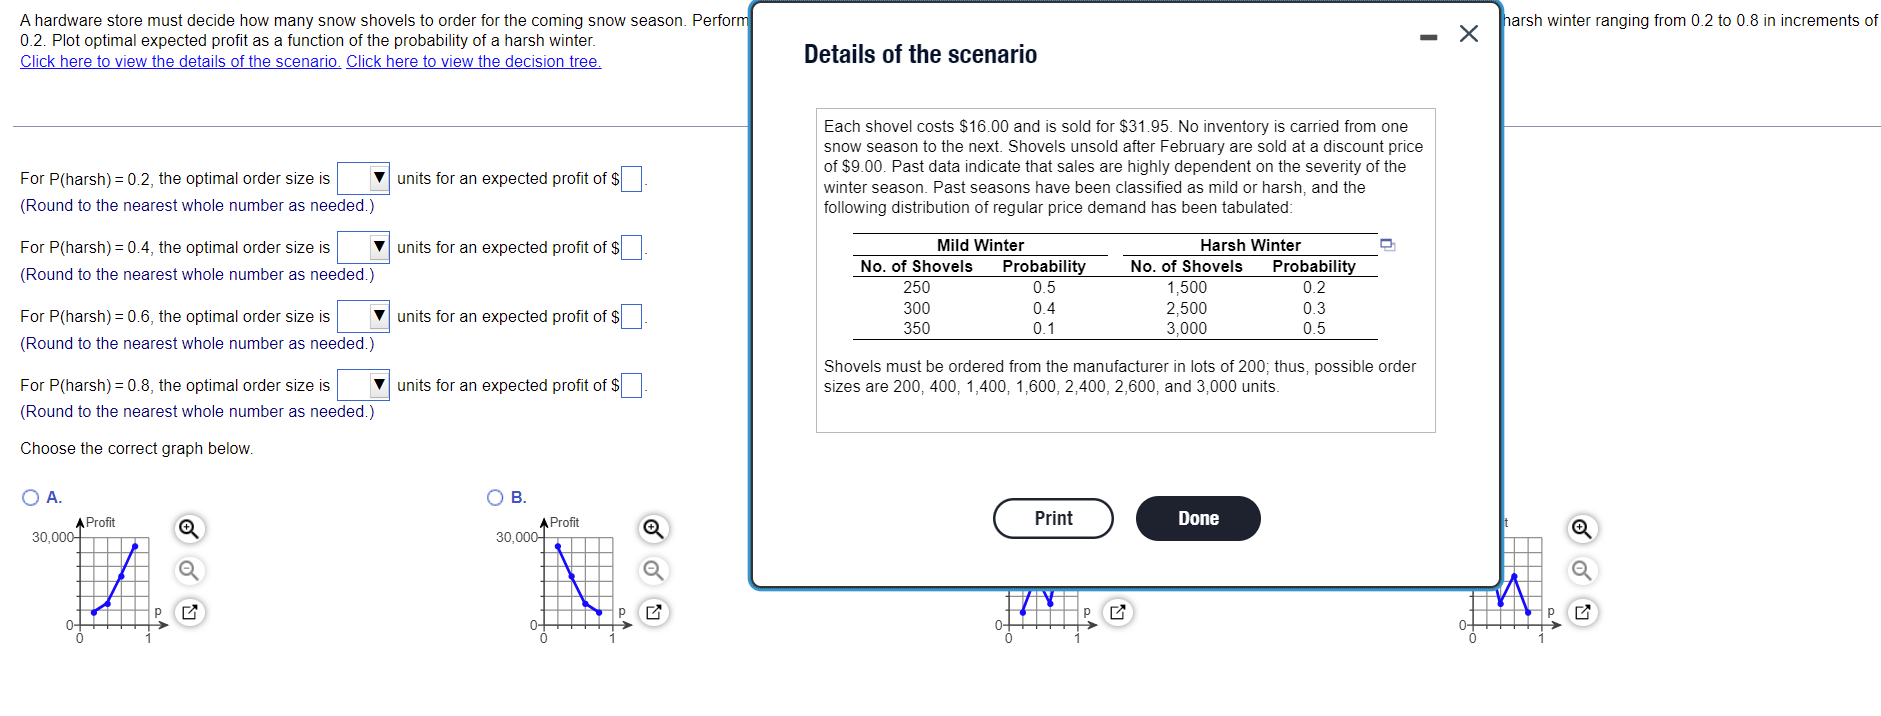
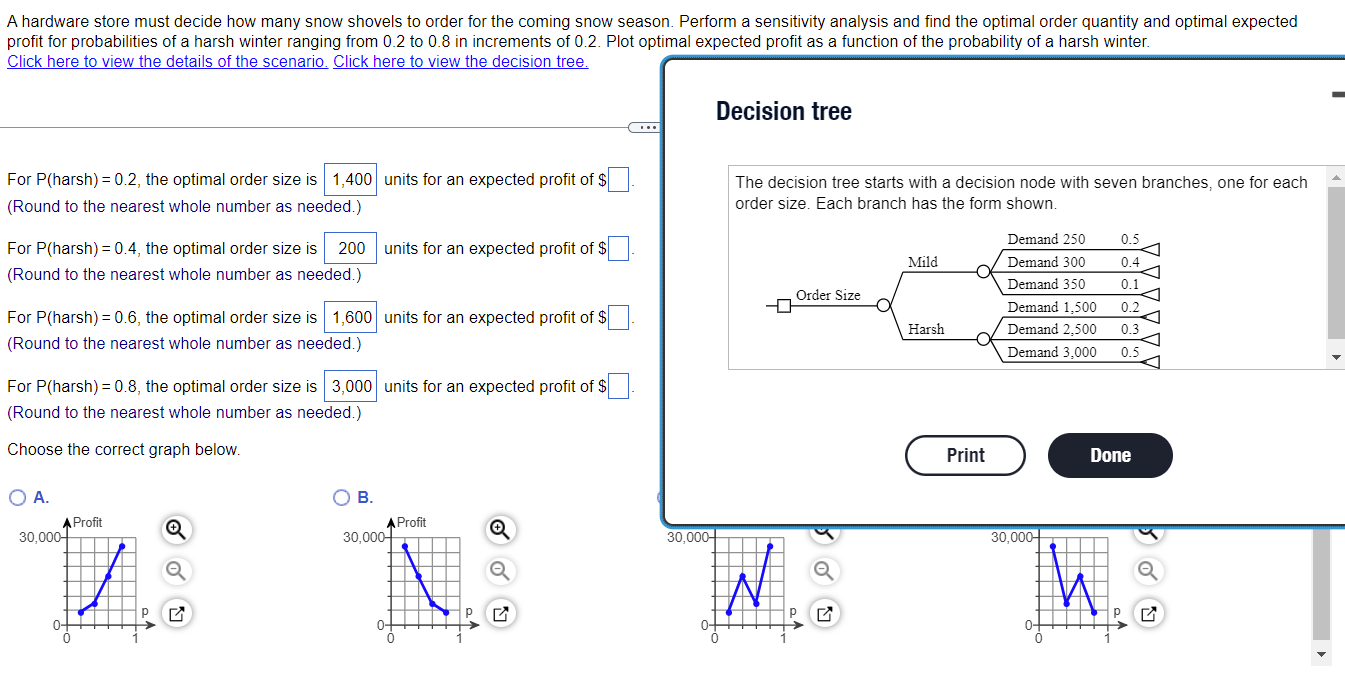
harsh winter ranging from 0.2 to 0.8 in increments of - A hardware store must decide how many snow shovels to order for the coming snow season. Perform 0.2. Plot optimal expected profit as a function of the probability of a harsh winter. Click here to view the details of the scenario. Click here to view the decision tree. X Details of the scenario Each shovel costs $16.00 and is sold for $31.95. No inventory is carried from one snow season to the next. Shovels unsold after February are sold at a discount price of $9.00. Past data indicate that sales are highly dependent on the severity of the winter season. Past seasons have been classified as mild or harsh, and the following distribution of regular price demand has been tabulated: units for an expected profit of $ For P(harsh) = 0.2, the optimal order size is (Round to the nearest whole number as needed.) For P(harsh) = 0.4, the optimal order size is V units for an expected profit of $ (Round to the nearest whole number as needed.) Mild Winter No. of Shovels Probability 250 0.5 300 0.4 350 0.1 Harsh Winter No. of Shovels Probability 1,500 0.2 2,500 0.3 3,000 0.5 For P(harsh) = 0.6, the optimal order size is v units for an expected profit of $ (Round to the nearest whole number as needed.) units for an expected profit of $ Shovels must be ordered from the manufacturer in lots of 200; thus, possible order sizes are 200, 400, 1,400, 1,600, 2,400, 2,600, and 3,000 units. For P(harsh) = 0.8, the optimal order size is (Round to the nearest whole number as needed.) Choose the correct graph below. OB. . A Profit 30,000 A Profit Print Done 30,000 7 HH TH ? P 0 0- 0 0 0 A hardware store must decide how many snow shovels to order for the coming snow season. Perform a sensitivity analysis and find the optimal order quantity and optimal expected profit for probabilities of a harsh winter ranging from 0.2 to 0.8 in increments of 0.2. Plot optimal expected profit as a function of the probability of a harsh winter. Click here to view the details of the scenario. Click here to view the decision tree. Decision tree For P(harsh) = 0.2, the optimal order size is 1,400 units for an expected profit of $ (Round to the nearest whole number as needed.) The decision tree starts with a decision node with seven branches, one for each order size. Each branch has the form shown. 0.5 For P(harsh) = 0.4, the optimal order size is 200 units for an expected profit of $ (Round to the nearest whole number as needed.) Mild 0.4 Order Size Demand 250 Demand 300 Demand 350 Demand 1,500 Demand 2,500 Demand 3,000 0.1 0.2 0.3 For P(harsh) = 0.6, the optimal order size is 1,600 units for an expected profit of $ (Round to the nearest whole number as needed.) Harsh 0.5 For P(harsh) = 0.8, the optimal order size is 3,000 units for an expected profit of $ (Round to the nearest whole number as needed.) Choose the correct graph below. Print Done OB. O A. A Profit 30,000 A Profit 30,000 30,000 30,000 N h PE PE po 0 0- 0 0- 0 0


