

Question: I'm using minitab till the trial ends then excel. thank you for the help. 5- Data represented below is the hardness of coil springs collected
I'm using minitab till the trial ends then excel. thank you for the help.
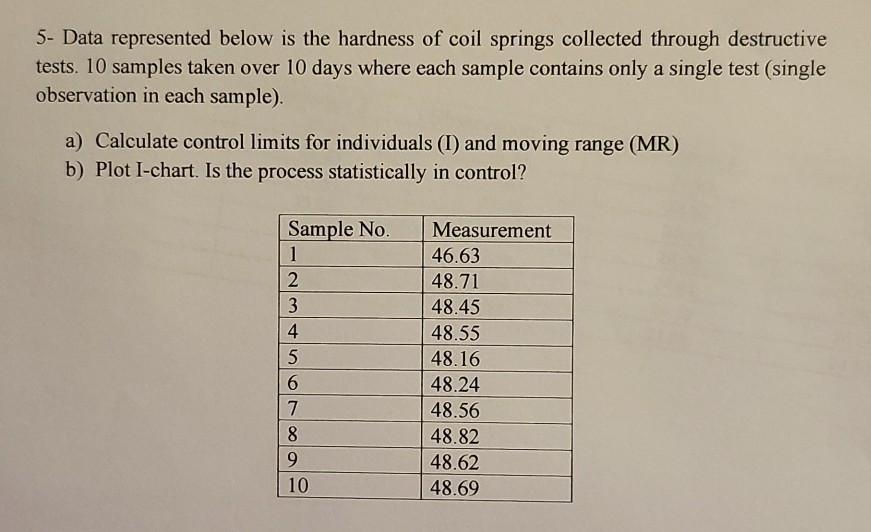
5- Data represented below is the hardness of coil springs collected through destructive tests. 10 samples taken over 10 days where each sample contains only a single test (single observation in each sample). a) Calculate control limits for individuals (I) and moving range (MR) b) Plot I-chart. Is the process statistically in control? Sample No. 1 2 3 4 5 6 7 8 9 10 Measurement 46.63 48.71 48.45 48.55 48.16 48.24 48.56 48.82 48.62 48.69Step by Step Solution
There are 3 Steps involved in it
1 Expert Approved Answer
Step: 1 Unlock

Question Has Been Solved by an Expert!
Get step-by-step solutions from verified subject matter experts
Step: 2 Unlock
Step: 3 Unlock