

Question: please write out formula (show steps for calculation please and use minitab to plot. 5- Data represented below is the hardness of coil springs collected
please write out formula (show steps for calculation please and use minitab to plot. 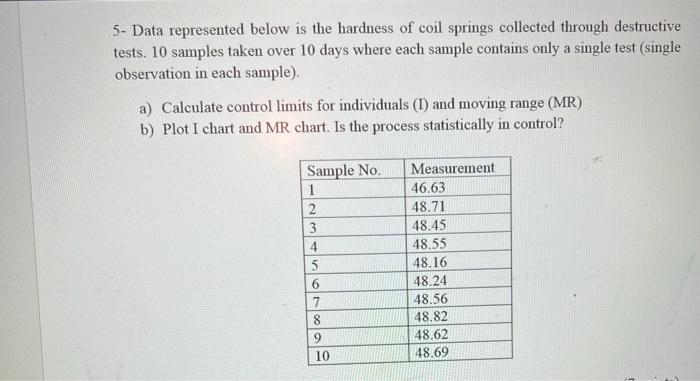
5- Data represented below is the hardness of coil springs collected through destructive tests. 10 samples taken over 10 days where each sample contains only a single test (single observation in each sample). a) Calculate control limits for individuals (I) and moving range (MR) b) Plot I chart and MR chart. Is the process statistically in control
Step by Step Solution
There are 3 Steps involved in it
1 Expert Approved Answer
Step: 1 Unlock

Question Has Been Solved by an Expert!
Get step-by-step solutions from verified subject matter experts
Step: 2 Unlock
Step: 3 Unlock