

Question: im using python. im having a hard time figuring out how to make subplots. one plot for each r value. im supposed to use plot
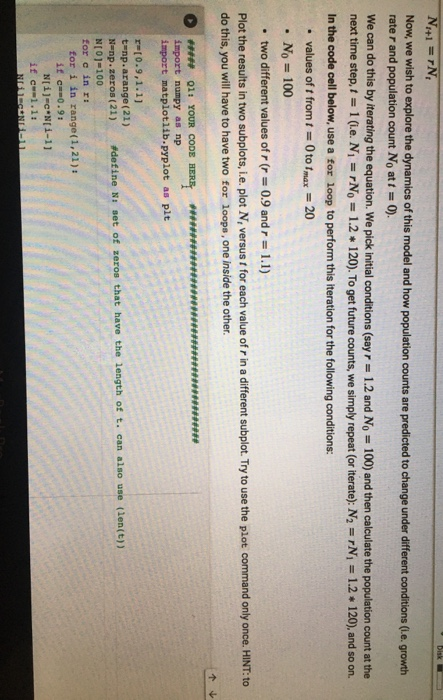
N+1 =rN, Now, we wish to explore the dynamics of this model and how population counts are predicted to change under different conditions (.e. growth rater and population count No at t = 0). We can do this by iterating the equation. We pick initial conditions (say r = 1.2 and No = 100) and then calculate the population count at the next time step, I = 1 (i.e. Ni = rNo=1.2* 120). To get future counts, we simply repeat (or iterate): N2 = N; = 1.2*120), and so on. In the code cell below, use a for loop to perform this iteration for the following conditions: values of t from t = 0 to Imax = 20 . No = 100 two different values of r (r= 0.9 and r = 1.1) Plot the results in two subplots, i.e. plot N, versust for each value of r in a different subplot. Try to use the plot command only once. HINT: to do this, you will have to have two for loops, one inside the other. *********** ******* ##### 01: YOUR CODE HERE ************ import numpy as np import matplotlib.pyplot as plt r=[0.9,1.11 t=np.arange (21) Nanp.zeros(21) #define N: set of zeros that have the length of t. can also use (len(t)) N[0]=100 for c in r: for i in range(1,21): if c=0.9: N[i]-c*N[i-1] if cw1.1: DECU
Step by Step Solution
There are 3 Steps involved in it

Get step-by-step solutions from verified subject matter experts