

Question: Image caption: The x axis shows the day, ranging from day 1 to day 12. The y axis lists the activities, A through F. For
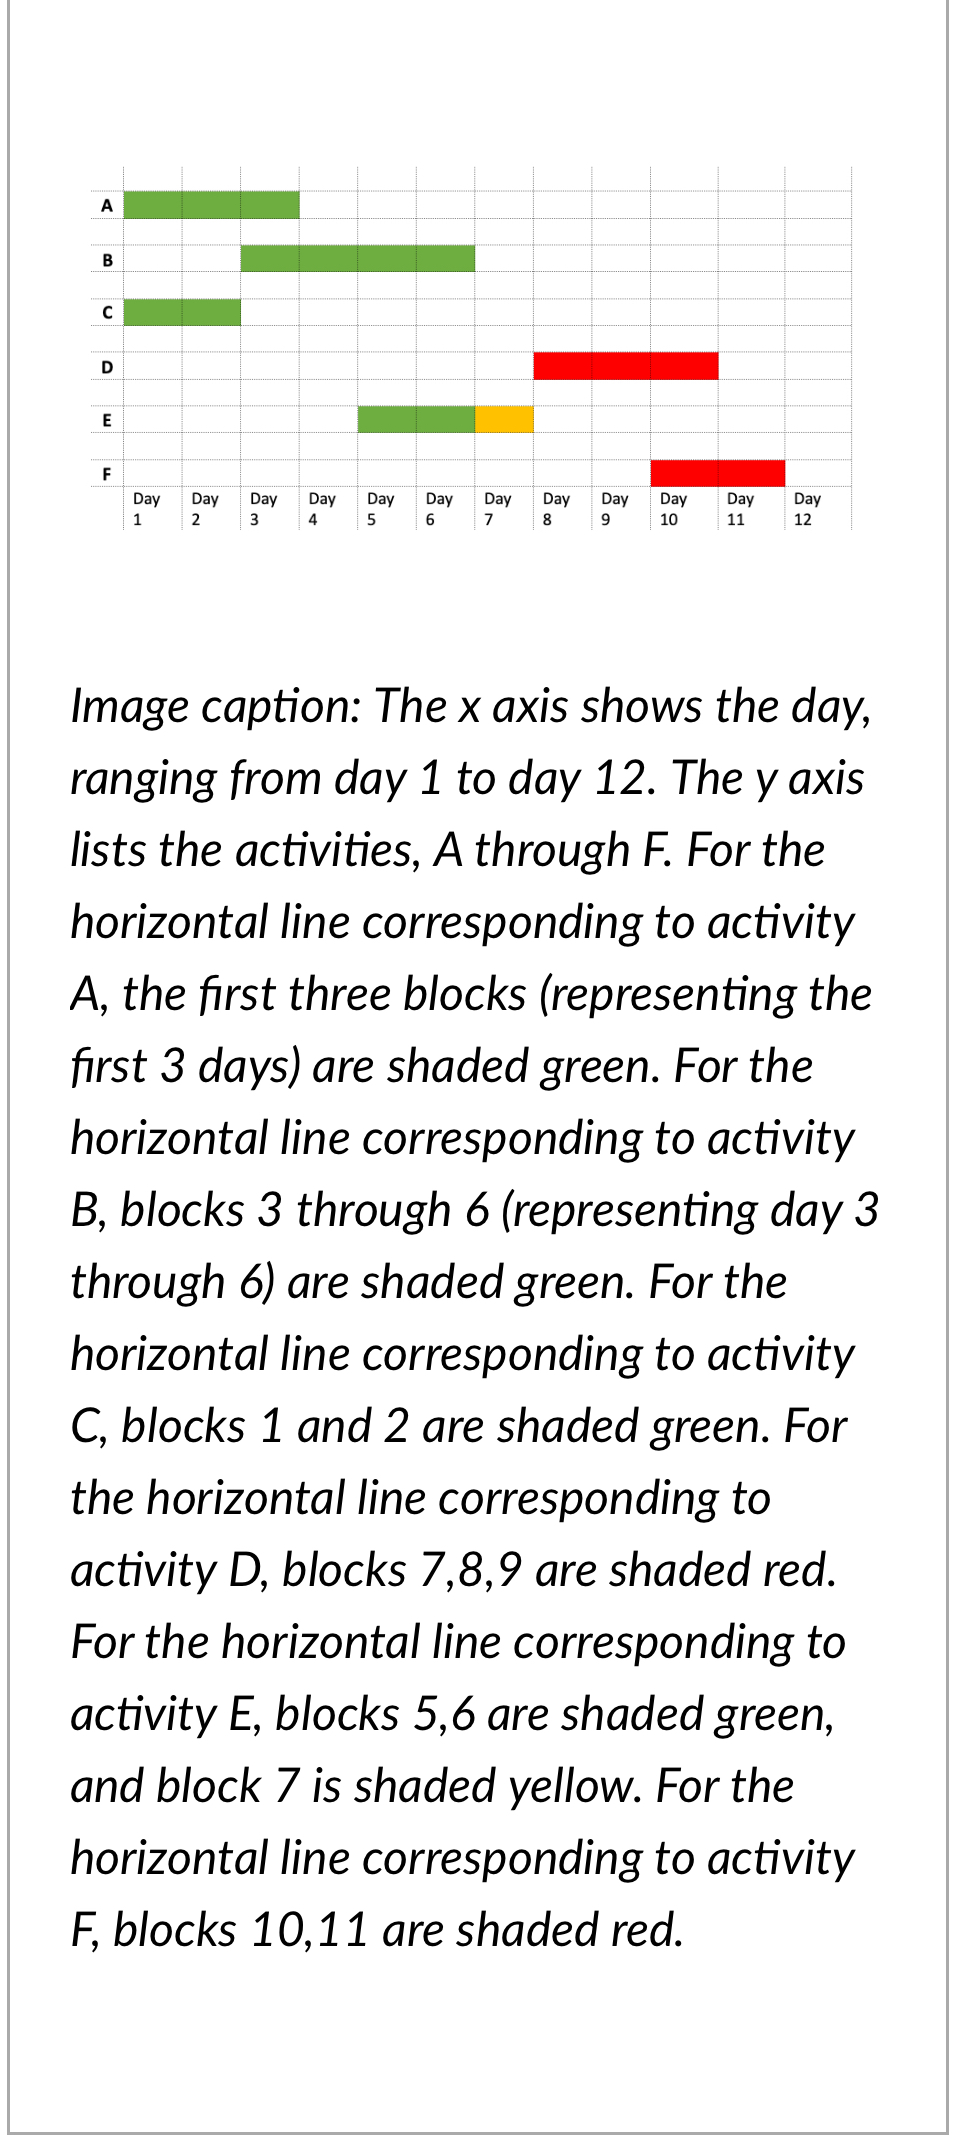
Image caption: The x axis shows the day, ranging from day 1 to day 12. The y axis lists the activities, A through F. For the horizontal line corresponding to activity A, the first three blocks (representing the first 3 days) are shaded green. For the horizontal line corresponding to activity B, blocks 3 through 6 (representing day 3 through 6) are shaded green. For the horizontal line corresponding to activity C, blocks 1 and 2 are shaded green. For the horizontal line corresponding to activity D, blocks 7,8,9 are shaded red. For the horizontal line corresponding to activity E, blocks 5,6 are shaded green, and block 7 is shaded yellow. For the horizontal line corresponding to activity F, blocks 10,11 are shaded red.
What is the cost variance at the end of day 7?
Image caption: The x axis shows the day, ranging from day 1 to day 12 . The y axis lists the activities, A through F. For the horizontal line corresponding to activity A, the first three blocks (representing the first 3 days) are shaded green. For the horizontal line corresponding to activity B, blocks 3 through 6 (representing day 3 through 6) are shaded green. For the horizontal line corresponding to activity C, blocks 1 and 2 are shaded green. For the horizontal line corresponding to activity D, blocks 7,8,9 are shaded red. For the horizontal line corresponding to activity E, blocks 5,6 are shaded green, and block 7 is shaded yellow. For the horizontal line corresponding to activity F, blocks 10,11 are shaded red
Step by Step Solution
There are 3 Steps involved in it

Get step-by-step solutions from verified subject matter experts