

Question: Need help with this question. Image Caption: The x axis shows the day, ranging from day 1 to day 12 . The y axis lists
Need help with this question.
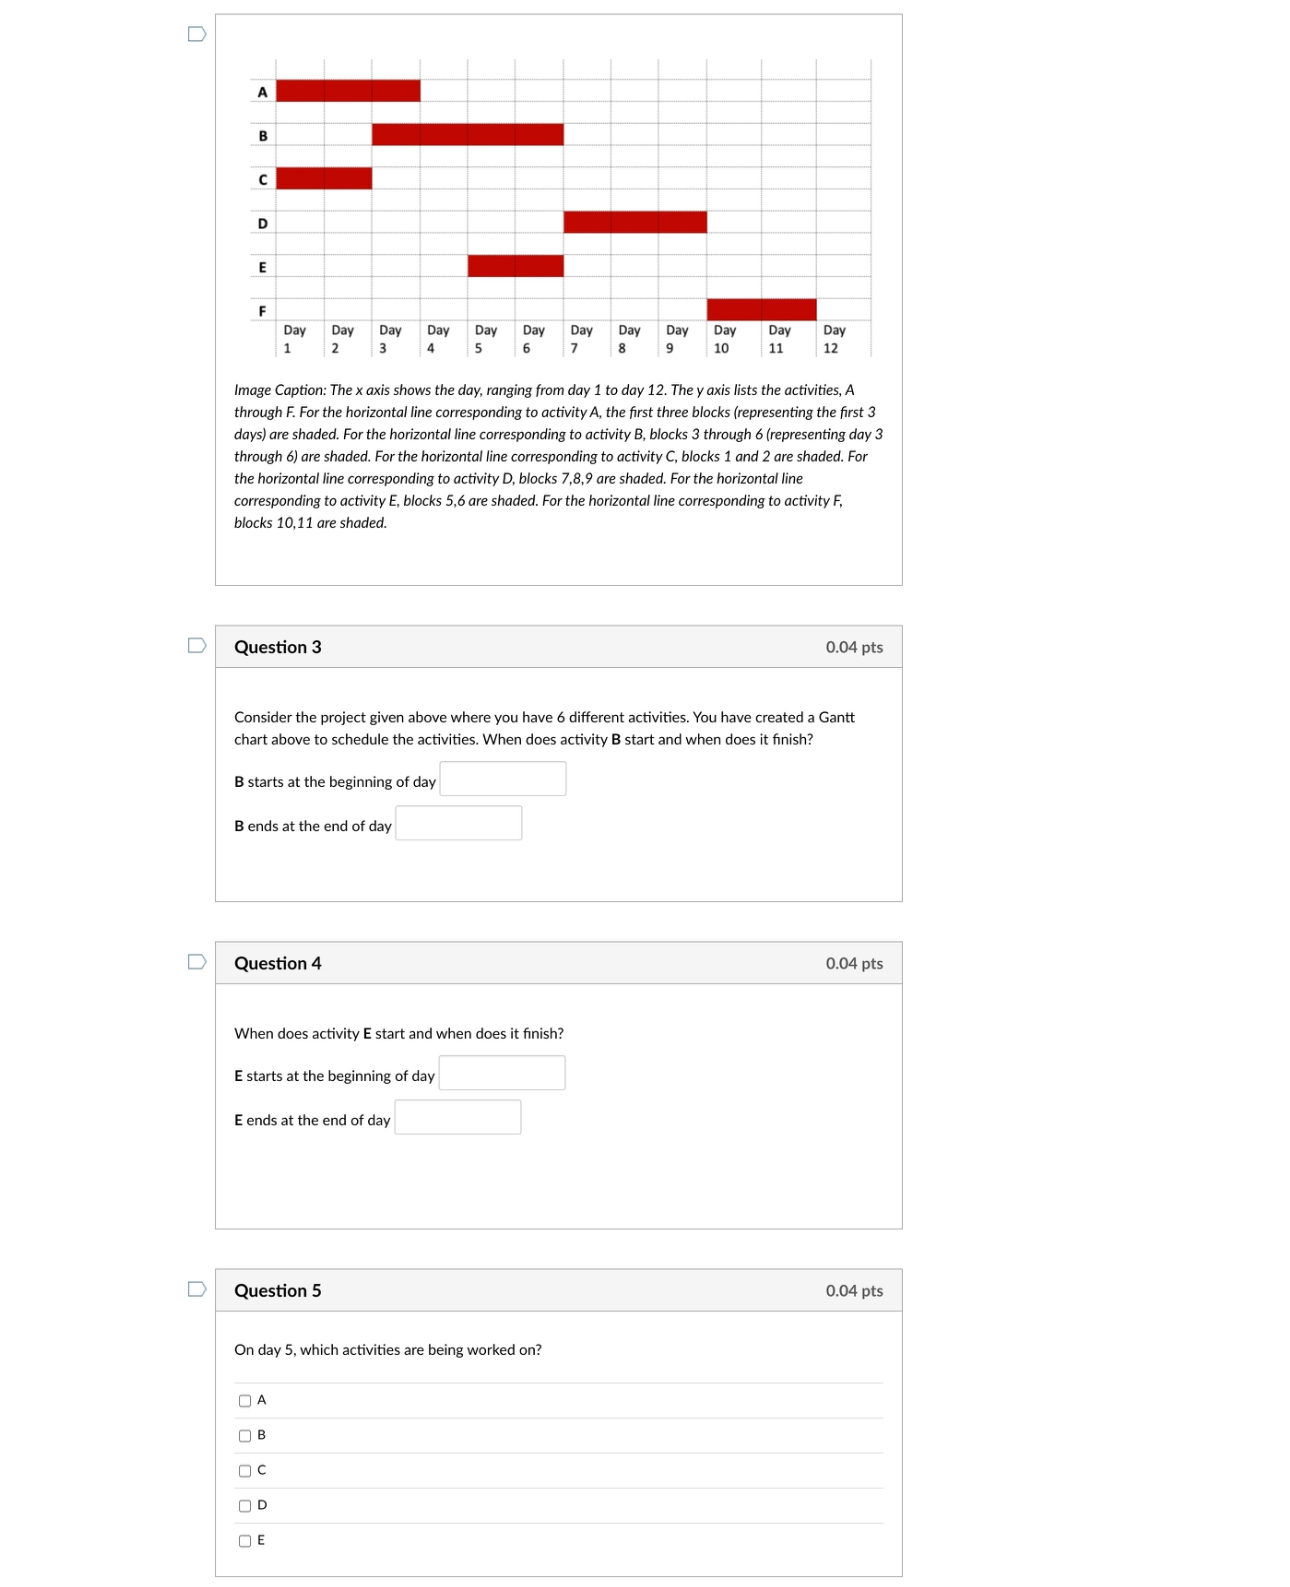
Image Caption: The x axis shows the day, ranging from day 1 to day 12 . The y axis lists the activities, A through F. For the horizontal line corresponding to activity A, the first three blocks (representing the first 3 days) are shaded. For the horizontal line corresponding to activity B, blocks 3 through 6 (representing day 3 through 6) are shaded. For the horizontal line corresponding to activity C, blocks 1 and 2 are shaded. For the horizontal line corresponding to activity D, blocks 7,8,9 are shaded. For the horizontal line corresponding to activity E, blocks 5,6 are shaded. For the horizontal line corresponding to activity F, blocks 10,11 are shaded. Question 3 0.04 pts Consider the project given above where you have 6 different activities. You have created a Gantt chart above to schedule the activities. When does activity B start and when does it finish? B starts at the beginning of day B ends at the end of day Question 4 0.04 pts When does activity E start and when does it finish? E starts at the beginning of day E ends at the end of day Question 5 0.04pts On day 5 , which activities are being worked on? A B C D E
Step by Step Solution
There are 3 Steps involved in it

Get step-by-step solutions from verified subject matter experts