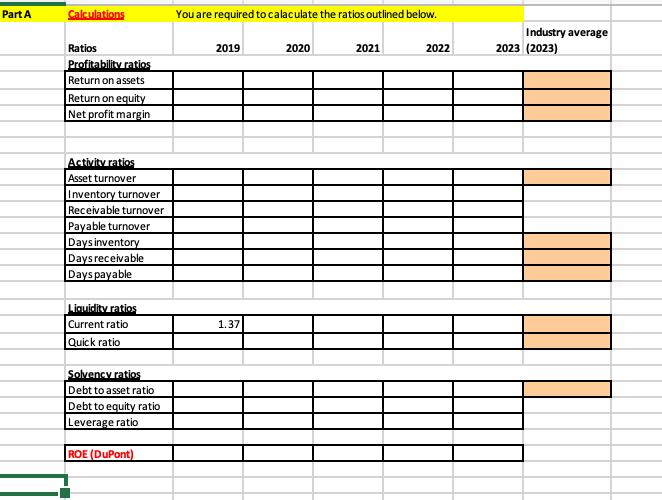
Question: Image transcription text A B C D E F 1 JB Hi-Fi Limited (JBH) All figures in millions of Australian Dollar. & W N Income

Screenshot 2024-03-06 at 12.13.02 pm.png

Image transcription text

A B C D E F 1 JB Hi-Fi Limited (JBH) All figures in millions of Australian Dollar. & W N Income statement data un 2019 2020 2021 2022 2023 Sales 7,095.3 7,918.9 8,916.1 9,232.0 9,626.4 Cost of sales (5,568.2) (6,224.8) (6,938.9) (7,151.6) (7 443.9 8 Gross profit 1,527.1 1,694.1 1,977.2 2,080.4 2, 182.5 9 Other income 2.4 3.6 2.9 3.0 7.6 10 Finance costs (14.3) (36.4) (24.7) (20.1) (26.3 11 Sales and marketing expenses (731.0) (809.8) (845.8) (881.1) (978.3 12 Occupancy expenses (306.4) (313.1) (293.6) (302.8) (321.8 13 Administration expenses (44.5) (41.7) (41.3) (41.8) (46.0 14 Other expenses (74.0) (48.7) (54.7) (62.3) (70.6) 15 Profit before tax 359.3 448.0 720.0 775.3 747.1 16 Tax expense (109.5) (145.7) (213.9) (230.4) (222.5 17 Net profit after tax 249.8 302.3 506.1 544.9 524.6 18 19 Balance sheet data 20 2019 2020 2021 2022 2023 21 Current assets 22 Cash and cash equivalent 119.2 251.5 263.2 125.6 177.3 23 Trade and other receivables 254.4 220.3 102.8 132.6 146.5 24 Inventories 886.7 739.3 938.8 1,135.3 1,040.9 25 Other current assets 34.6 34.7 35.7 31.2 34.6 26 Total current assets 1,294.9 1,245.8 1,340.5 1,424.7 1,399.3 27 Non-current assets 28 Plant and equipment 191.5 172.3 169.0 169.0 182.8 29 Deferred tax assets 2.7 22.2 30.3 30.6 41.1 30 Other non-current assets 40.8 38.4 39.0 44. 1 50.2 31 Intangibles & goodwill 1,037.3 1,031.4 1,031.4 1,031.4 1,031.4 32 Right-of-use assets 642.2 536.3 461.6 530.1 33 Totalnon-current assets 1,272.3 1,906.5 1,806.0 1,736.7 1, 835.6 34 Totalassets 2,567.2 3,152.3 3,146.5 3,161.4 3,234.9 35 Current Liabilities 36 Trade and other payables 672.7 854.1 668.6 721.6 660.5 37 Deferred revenue 165.8 196.6 212.9 253.5 231.0 38 Provisions 93.9 98.9 105.5 109.4 115.0 39 Lease liabilities 164.0 167.3 167.0 174.1 40 Current tax liabilities 5.1 32.3 92.2 54.8 4.3 41 Other current liabilities 8.0 42 Total current liabilities 945.5 1,345.9 1,246.5 1,306.3 1, 184.9 43 Non-current liabilities 44 Borrowings 439.1 59.4 49.8 45 Deferred revenue 90.1 81.6 85.0 94.7 106.9 46 Provisions 15.2 41.5 42.6 42.7 42.5 47 Other non-current liabilities 33.2 48 Lease liabilities 577.6 464.0 378.0 431.2 49 Total non-current liabilities 577.6 700.7 591.6 574.8 630.4 50 Total liabilities 1,523.1 2,046.6 1, 838.1 1, 881.1 1,815.3 51 Equity 52 Contributed equity 434.8 403.2 393.0 346.8 329.3 53 Reserves 53.7 66.8 83.8 22.8 25.4 54 Retained earnings 555.6 635.7 831.6 910.7 1,064.9 55 Totalequity 1, 044.1 1, 105.7 1,308.4 1,280.3 1, 419.6 56 Total liabilities and equity 2,567.2 3,152.3 3,146.5 3,161.4 3,234.9 57 
Screenshot 2024-03-06 at 12.13.08 pm.png

Image transcription text

Part A Calculations You are required to calaculate the ratios outlined below. Industry average Ratios 2019 2020 2021 2022 2023 (2023) Profitability ratios Return on assets Return on equity Net profit margin Activity ratios Asset turnover Inventory turnover Receivable turnover Days inventory Daysreceivable Days payable Liquidity ratios Current ratio 1.37 Quick ratio Solvency ratios Debt to asset ratio Debt to equity ratio Leverage ratio ROE (DuPont)
 

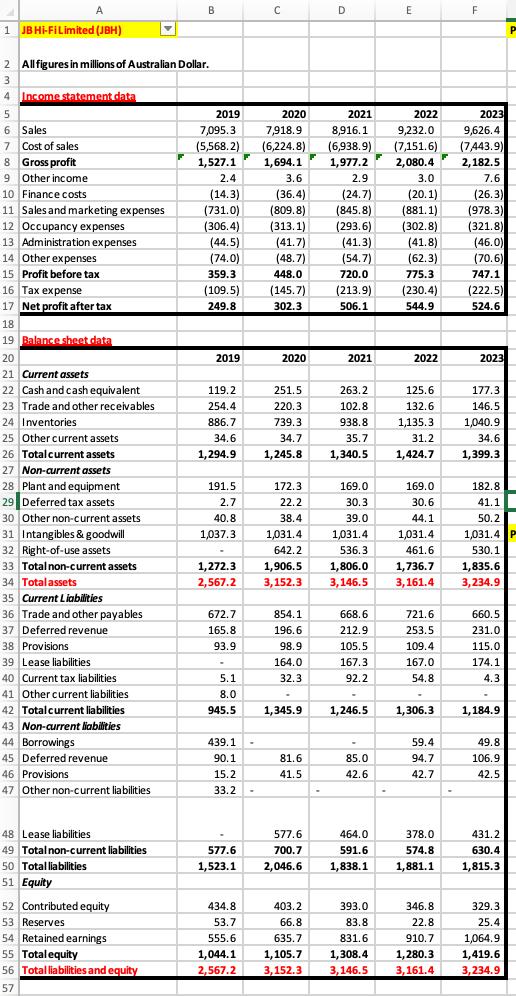
1 JB Hi-Fi Limited (JBH) 2 All figures in millions of Australian Dollar. 3 4 Income statement data B C D E F 5 6 Sales 7 Cost of sales 2019 2020 2021 2022 2023 7,095.3 7,918.9 8,916.1 9,232.0 9,626.4 (5,568.2) (6,224.8) (6,938.9) (7,151.6) (7,443.9) 8 Gross profit 1,527.1 1,694.1 1,977.2 2,080.4 2,182.5 9 Other income 2.4 3.6 2.9 3.0 7.6 10 Finance costs (14.3) (36.4) (24.7) (20.1) (26.3) 11 Sales and marketing expenses (731.0) (809.8) (845.8) (881.1) (978.3) 12 Occupancy expenses (306.4) (313.1) (293.6) (302.8) (321.8) 13 Administration expenses (44.5) (41.7) (41.3) (41.8) (46.0) 14 Other expenses (74.0) (48.7) (54.7) (62.3) (70.6) 15 Profit before tax 359.3 448.0 720.0 775.3 747.1 16 Tax expense (109.5) (145.7) (213.9) (230.4) (222.5) 17 Net profit after tax 249.8 302.3 506.1 544.9 524.6 18 19 Balance sheet data 20 2019 2020 2021 2022 2023 21 Current assets 22 Cash and cash equivalent 119.2 251.5 263.2 125.6 177.3 23 Trade and other receivables 254.4 220.3 102.8 132.6 146.5 24 Inventories 886.7 739.3 938.8 1,135.3 1,040.9 25 Other current assets 34.6 34.7 35.7 26 Total current assets 1,294.9 1,245.8 1,340.5 31.2 1,424.7 34.6 1,399.3 27 Non-current assets 28 Plant and equipment 191.5 172.3 169.0 169.0 182.8 29 Deferred tax assets 2.7 22.2 30.3 30.6 41.1 30 Other non-current assets 40.8 38.4 39.0 44.1 50.2 31 Intangibles & goodwill 1,037.3 1,031.4 1,031.4 1,031.4 1,031.4 32 Right-of-use assets 642.2 536.3 461.6 33 Total non-current assets 1,272.3 1,906.5 1,806.0 1,736.7 530.1 1,835.6 34 Total assets 2,567.2 3,152.3 3,146.5 3,161.4 3,234.9 35 Current Liabilities 36 Trade and other payables 672.7 854.1 668.6 721.6 660.5 37 Deferred revenue 165.8 196.6 212.9 253.5 231.0 38 Provisions 93.9 98.9 105.5 109.4 115.0 39 Lease liabilities 164.0 167.3 167.0 174.1 40 Current tax liabilities 5.1 32.3 92.2 54.8 4.3 41 Other current liabilities 8.0 42 Total current liabilities 945.5 1,345.9 1,246.5 1,306.3 1,184.9 43 Non-current liabilities 44 Borrowings 439.1 59.4 49.8 45 Deferred revenue 90.1 81.6 85.0 94.7 106.9 46 Provisions 15.2 41.5 42.6 42.7 42.5 47 Other non-current liabilities 33.2 48 Lease liabilities 577.6 464.0 378.0 431.2 49 Total non-current liabilities 577.6 700.7 591.6 574.8 630.4 50 Total liabilities 1,523.1 2,046.6 1,838.1 1,881.1 1,815.3 51 Equity 52 Contributed equity 434.8 403.2 393.0 53 Reserves 53.7 66.8 54 Retained earnings 555.6 55 Total equity 1,044.1 56 Total liabilities and equity 2,567.2 635.7 1,105.7 3,152.3 3,146.5 83.8 831.6 346.8 22.8 329.3 25.4 1,308.4 910.7 1,280.3 1,064.9 1,419.6 3,161.4 3,234.9 57

Step by Step Solution

There are 3 Steps involved in it

1 Expert Approved Answer
Step: 1 Unlock blur-text-image
Question Has Been Solved by an Expert!

Get step-by-step solutions from verified subject matter experts

Step: 2 Unlock
Step: 3 Unlock

Students Have Also Explored These Related Finance Questions!