

Question: Import data from Matlab_4_data.txt and plot the data as blue stars i.e. *. Now use 'Tools/Basic Fitting' from the figure window to find the best
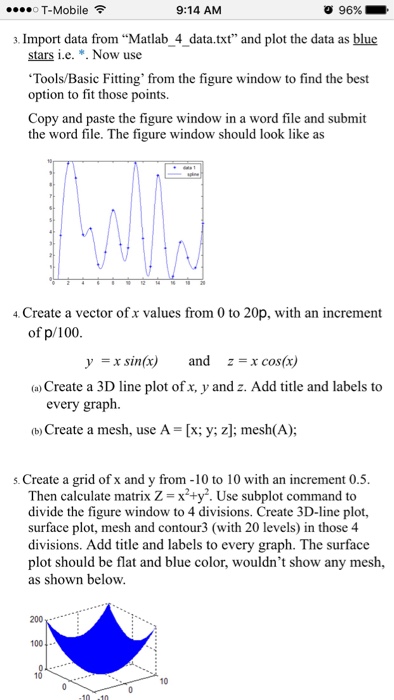
Import data from "Matlab_4_data.txt" and plot the data as blue stars i.e. *. Now use 'Tools/Basic Fitting' from the figure window to find the best option to fit those points. Copy and paste the figure window in a word file and submit the word file. The figure window should look like as Create a vector of x values from 0 to 20p, with an increment of p/100. y = x sin(x) and z = x cos(x) (a) Create a 3D line plot of x, y and z. Add title and labels to every graph. (b) Create a mesh, use A [x; y; z]; mesh(A); Create a grid of x and y from -10 to 10 with an increment 0.5. Then calculate matrix Z = x^2 + y^2. Use subplot command to divide the figure window to 4 divisions. Create 3D-line plot, surface plot, mesh and contour3 (with 20 levels) in those 4 divisions. Add title and labels to every graph. The surface plot should be flat and blue color, wouldn't show any mesh, as shown below
Step by Step Solution
There are 3 Steps involved in it

Get step-by-step solutions from verified subject matter experts