

Question: import matplotlib.pyplot as plt faoverfn - - for i in range(1,18) int(i) Ta over tn.append(x) #print(fa-over-fn) plt.plot(fa over fn) plt.xlabel( FA/FN') plt.ylabel('Farming Density') plt.show import
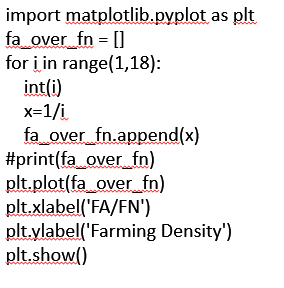
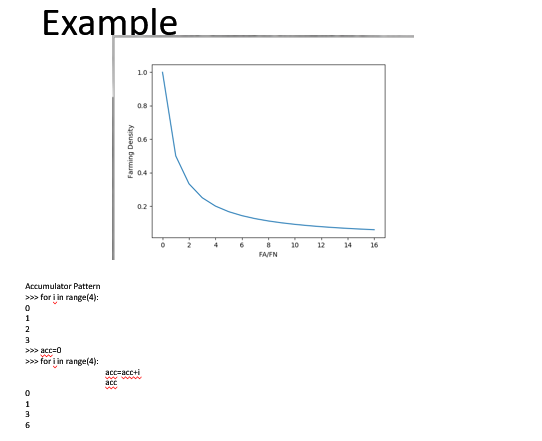
import matplotlib.pyplot as plt faoverfn - - for i in range(1,18) int(i) Ta over tn.append(x) #print(fa-over-fn) plt.plot(fa over fn) plt.xlabel( FA/FN') plt.ylabel('Farming Density') plt.show import matplotlib.pyplot as plt faoverfn - - for i in range(1,18) int(i) Ta over tn.append(x) #print(fa-over-fn) plt.plot(fa over fn) plt.xlabel( FA/FN') plt.ylabel('Farming Density') plt.show
Step by Step Solution
There are 3 Steps involved in it
1 Expert Approved Answer
Step: 1 Unlock

Question Has Been Solved by an Expert!
Get step-by-step solutions from verified subject matter experts
Step: 2 Unlock
Step: 3 Unlock