

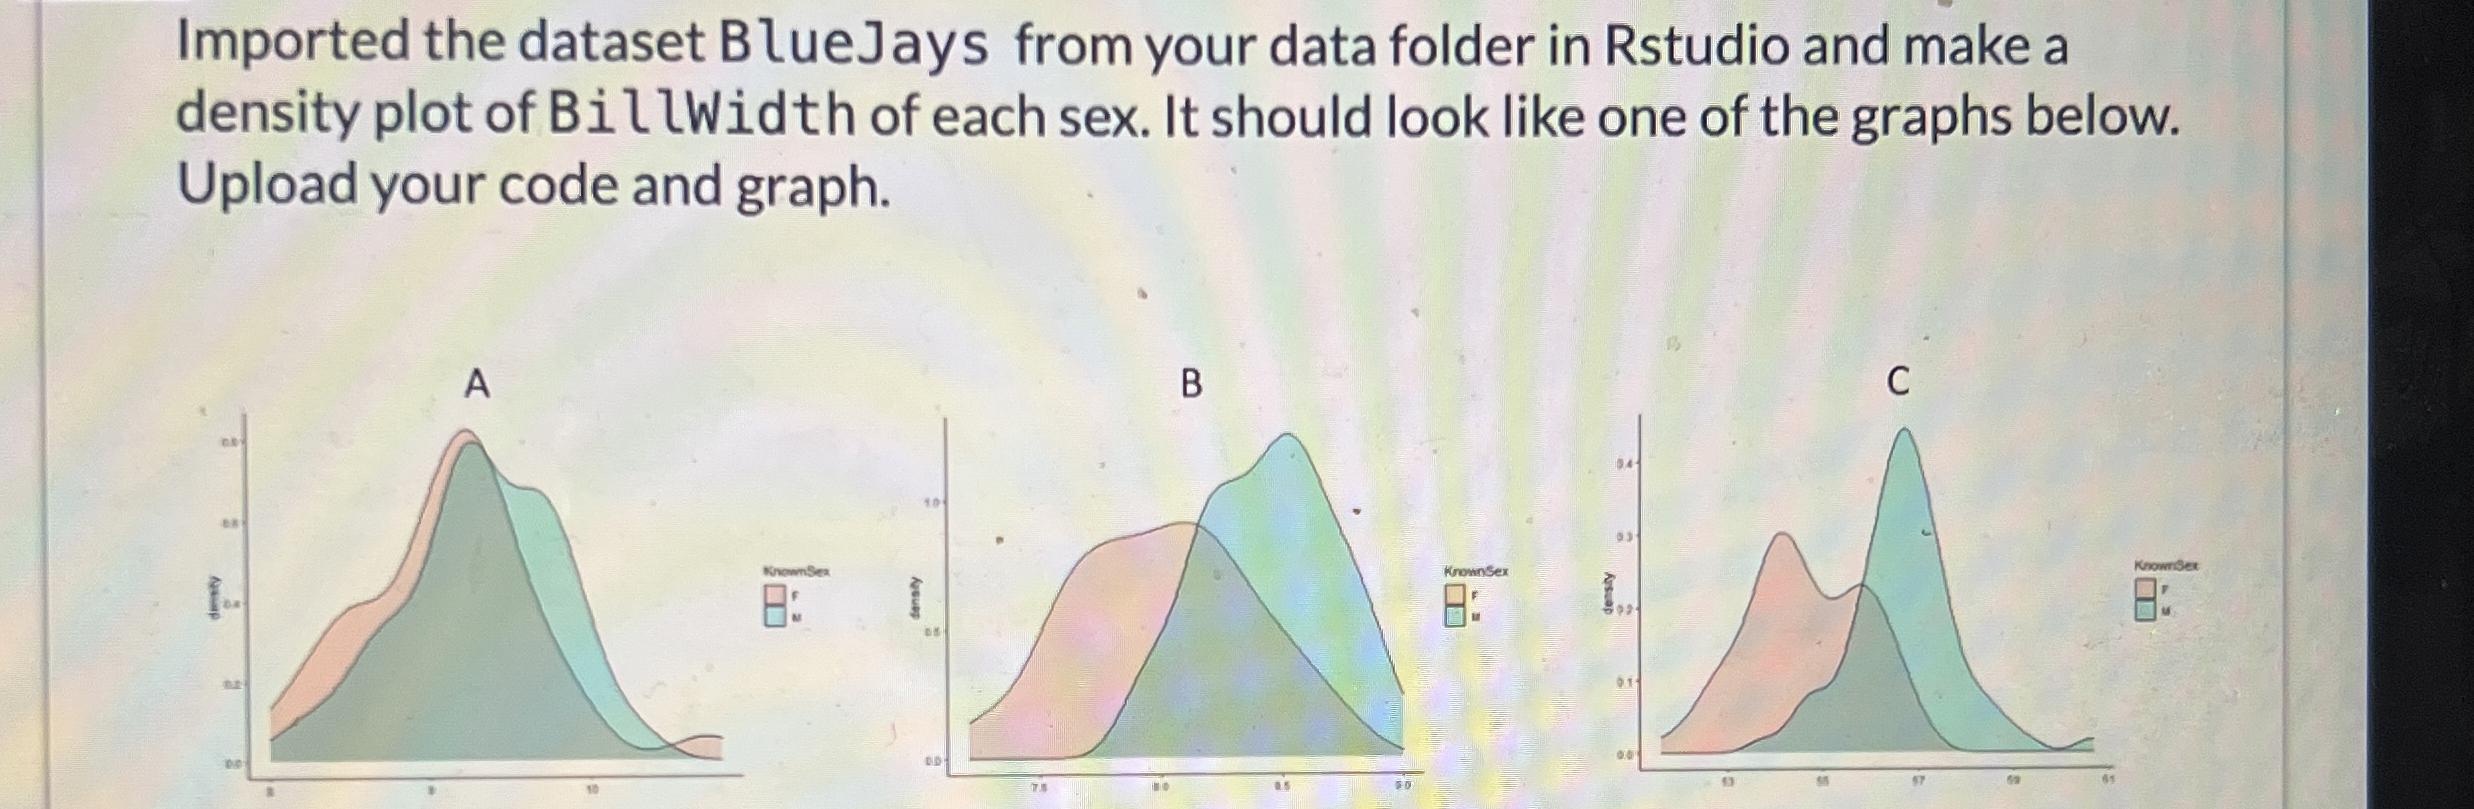
Question: Imported the dataset BlueJays from your data folder in Rstudio and make a density plot of BillWidth of each sex. It should look like one
Imported the dataset BlueJays from your data folder in Rstudio and make a
density plot of BillWidth of each sex. It should look like one of the graphs below.
Upload your code and graph.
Step by Step Solution
There are 3 Steps involved in it
1 Expert Approved Answer
Step: 1 Unlock

Question Has Been Solved by an Expert!
Get step-by-step solutions from verified subject matter experts
Step: 2 Unlock
Step: 3 Unlock