

Question: If you imported the dataset olives from your data folder in Rstudio, which graph would accurately represent a density plot of the linolenic acid content
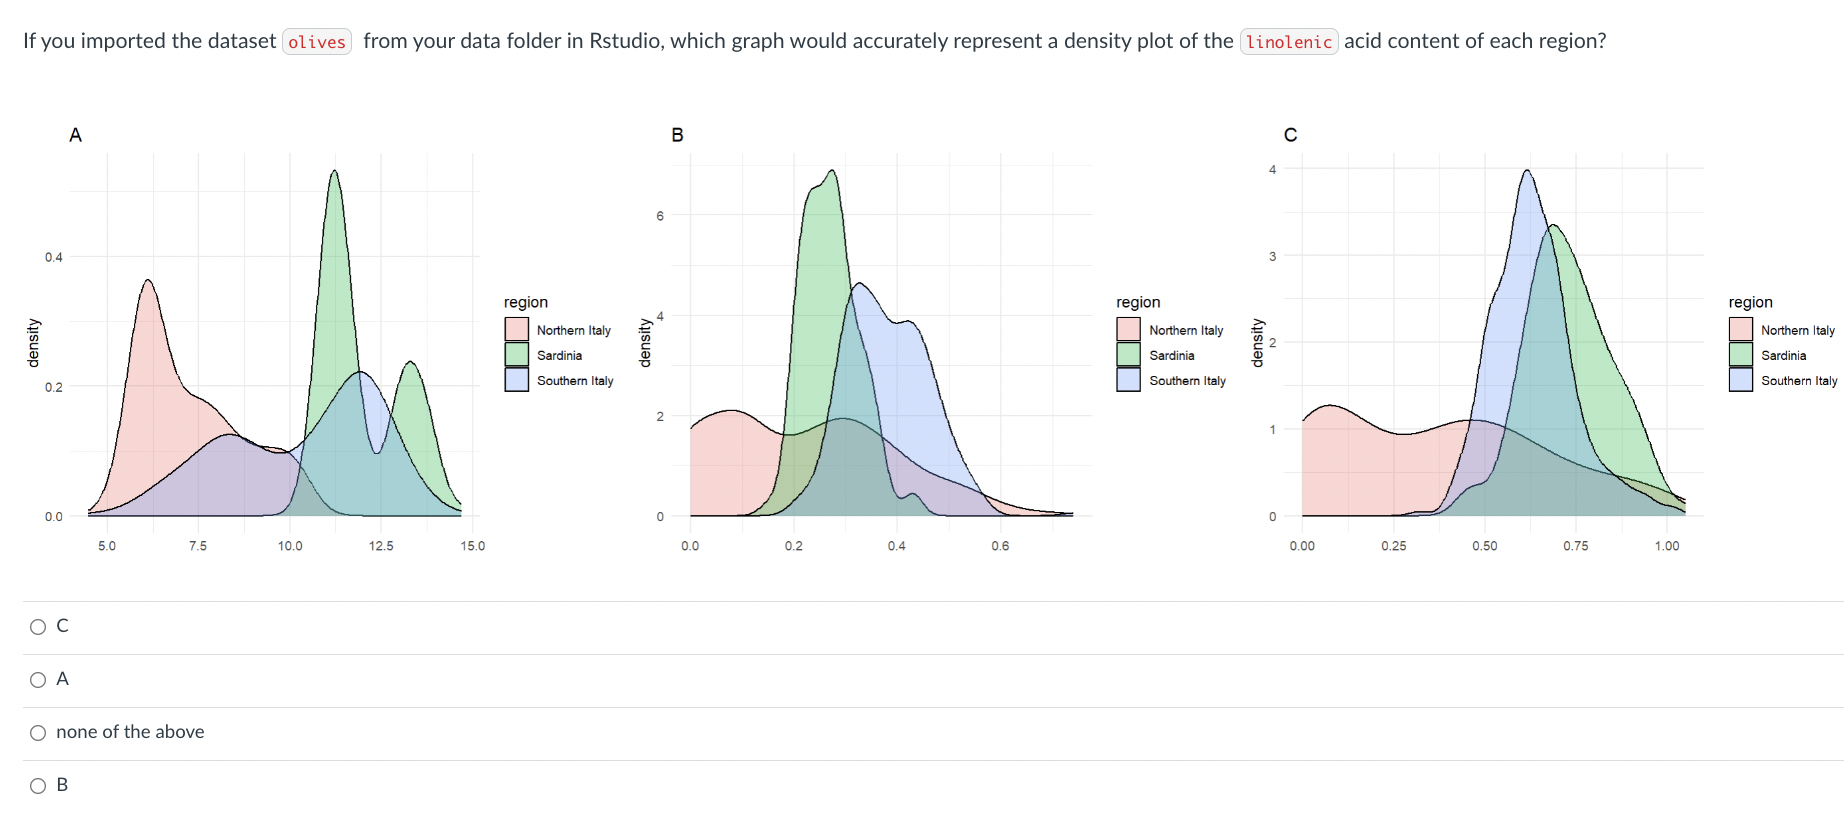
If you imported the dataset olives from your data folder in Rstudio, which graph would accurately represent a density plot of the linolenic acid content of each region?
C
A
none of the above
B
Step by Step Solution
There are 3 Steps involved in it
1 Expert Approved Answer
Step: 1 Unlock

Question Has Been Solved by an Expert!
Get step-by-step solutions from verified subject matter experts
Step: 2 Unlock
Step: 3 Unlock