

Question: Improve this service flow chart Consider the following process in a cafeteria with 5 different food stations. The number on the right of each task
Improve this service flow chart
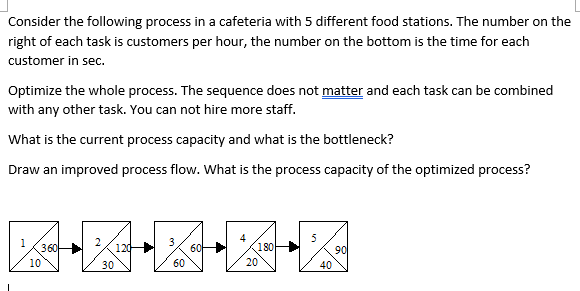
Consider the following process in a cafeteria with 5 different food stations. The number on the right of each task is customers per hour, the number on the bottom is the time for each customer in sec. Optimize the whole process. The sequence does not matter and each task can be combined with any other task. You can not hire more staff. What is the current process capacity and what is the bottleneck? Draw an improved process flow. What is the process capacity of the optimized process? 2 A 360 120 60 180 90 10 30 60 20 40
Step by Step Solution
There are 3 Steps involved in it
1 Expert Approved Answer
Step: 1 Unlock

Question Has Been Solved by an Expert!
Get step-by-step solutions from verified subject matter experts
Step: 2 Unlock
Step: 3 Unlock