

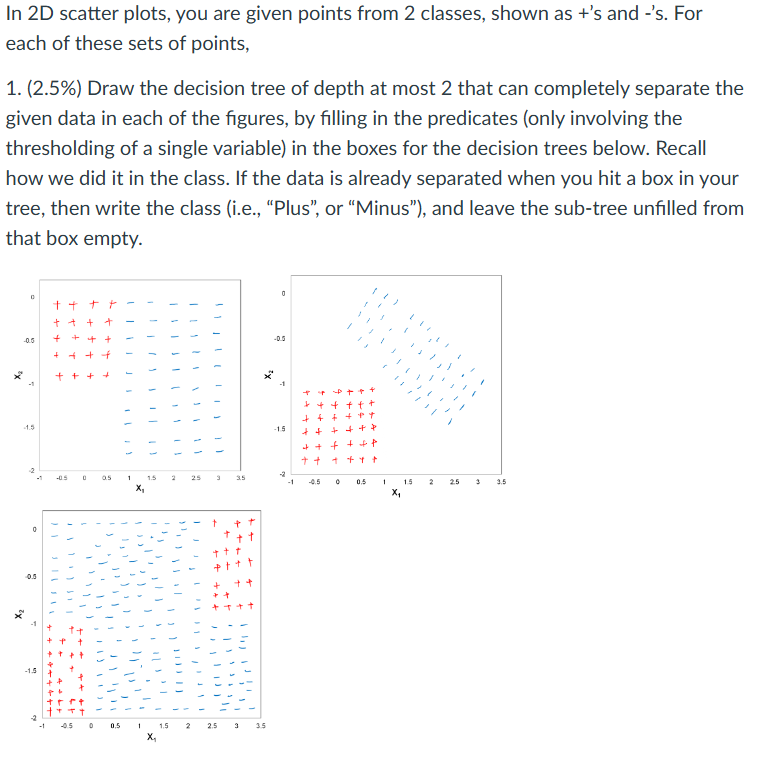
Question: In 2 D scatter plots, you are given points from 2 classes, shown as + s and - s . For each of these sets
In D scatter plots, you are given points from classes, shown as s and s For each of these sets of points,
Draw the decision tree of depth at most that can completely separate the given data in each of the figures, by filling in the predicates only involving the thresholding of a single variable in the boxes for the decision trees below. Recall how we did it in the class. If the data is already separated when you hit a box in your tree, then write the class iePlus or Minus and leave the subtree unfilled from that box empty. In D scatter plots, you are given points from classes, shown as s and s For each of these sets of points,
Draw the decision tree of depth at most that can completely separate the given data in each of the figures, by filling in the predicates only involving the thresholding of a single variable in the boxes for the decision trees below. Recall how we did it in the class. If the data is already separated when you hit a box in your tree, then write the class ie "Plus", or "Minus" and leave the subtree unfilled from that box empty. Draw splits on the scatter plots and write the class labels for each of the resulting bins somewhere inside the resulting bins such as "Plus" or "Minus". If you think the data in any of these examples cannot be completely separated by a depth tree, then do not draw anything on it and simply indicate "Inseparable data".
Step by Step Solution
There are 3 Steps involved in it
1 Expert Approved Answer
Step: 1 Unlock

Question Has Been Solved by an Expert!
Get step-by-step solutions from verified subject matter experts
Step: 2 Unlock
Step: 3 Unlock