

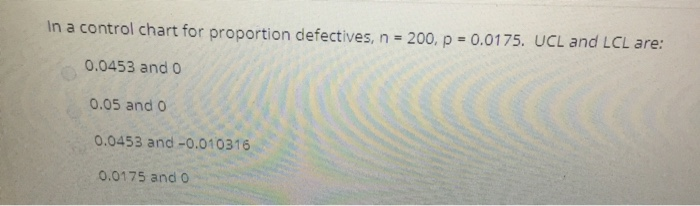
Question: In a control chart for proportion defectives, n = 200, p = 0.0175. UCL and LCL are: 0.0453 and o 0.05 and o 0.0453 and
Step by Step Solution
There are 3 Steps involved in it
1 Expert Approved Answer
Step: 1 Unlock

Question Has Been Solved by an Expert!
Get step-by-step solutions from verified subject matter experts
Step: 2 Unlock
Step: 3 Unlock