

Question: In a fabric manufacturing factory, the quality control process using control charts from SPC. In an hour there are a tota of 5 samples are
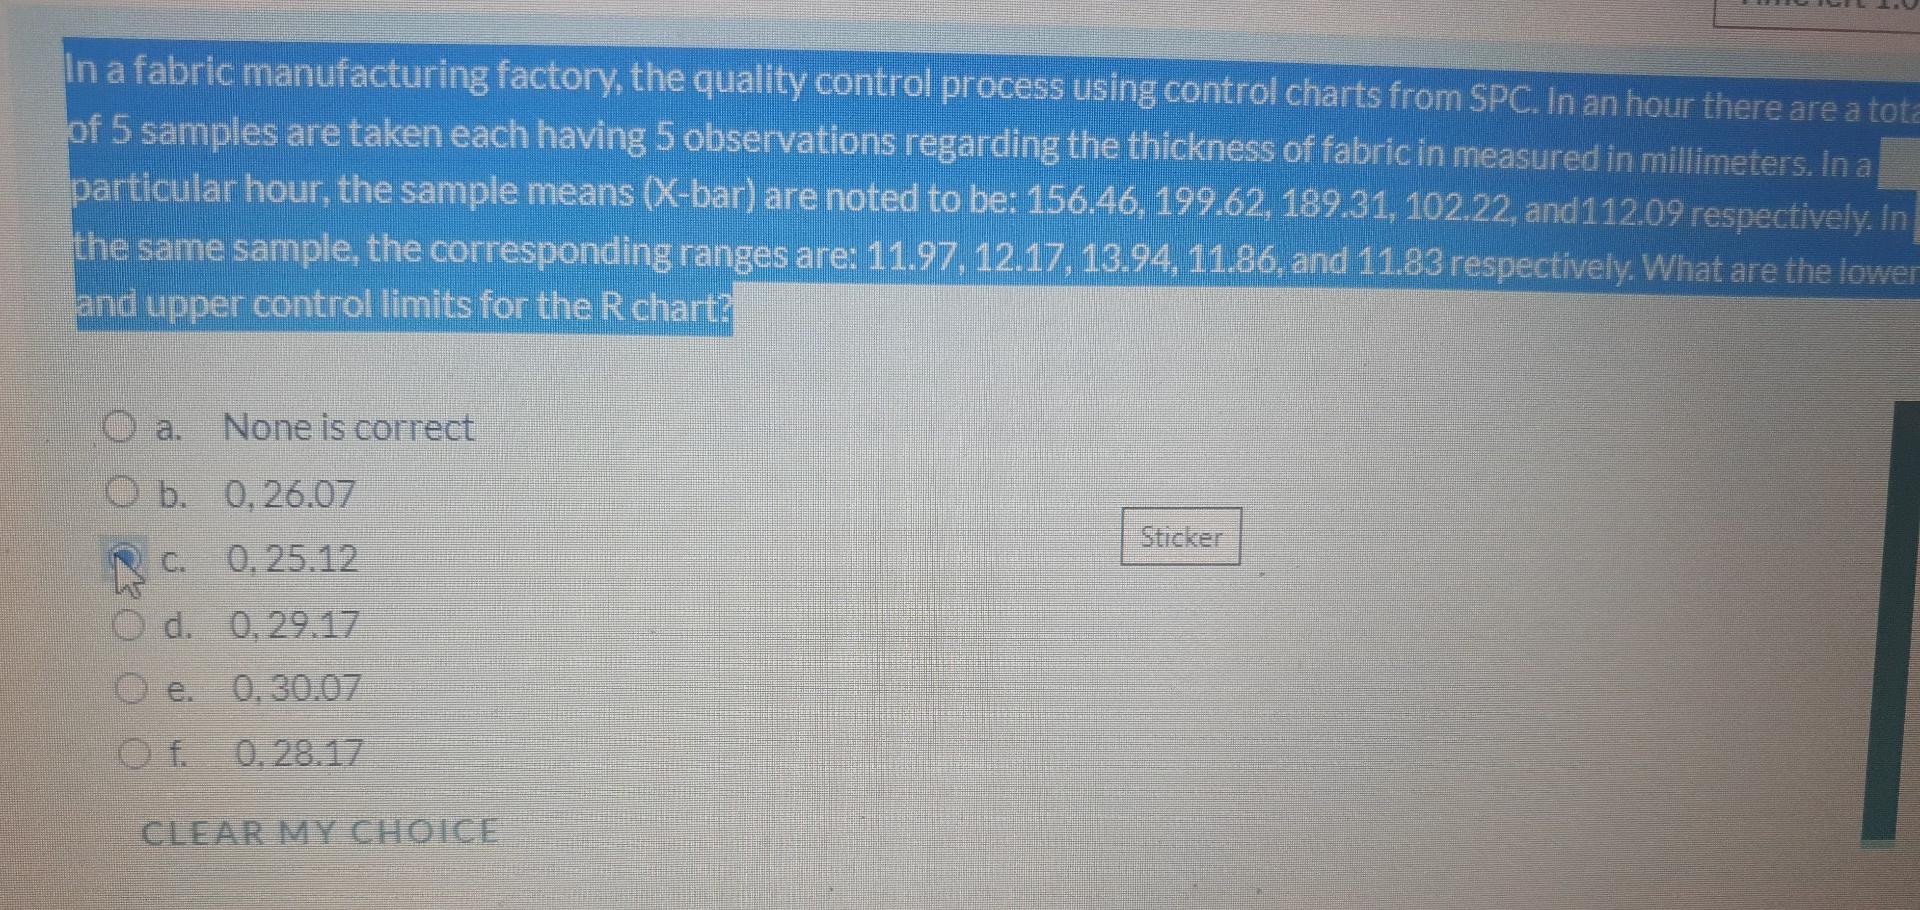
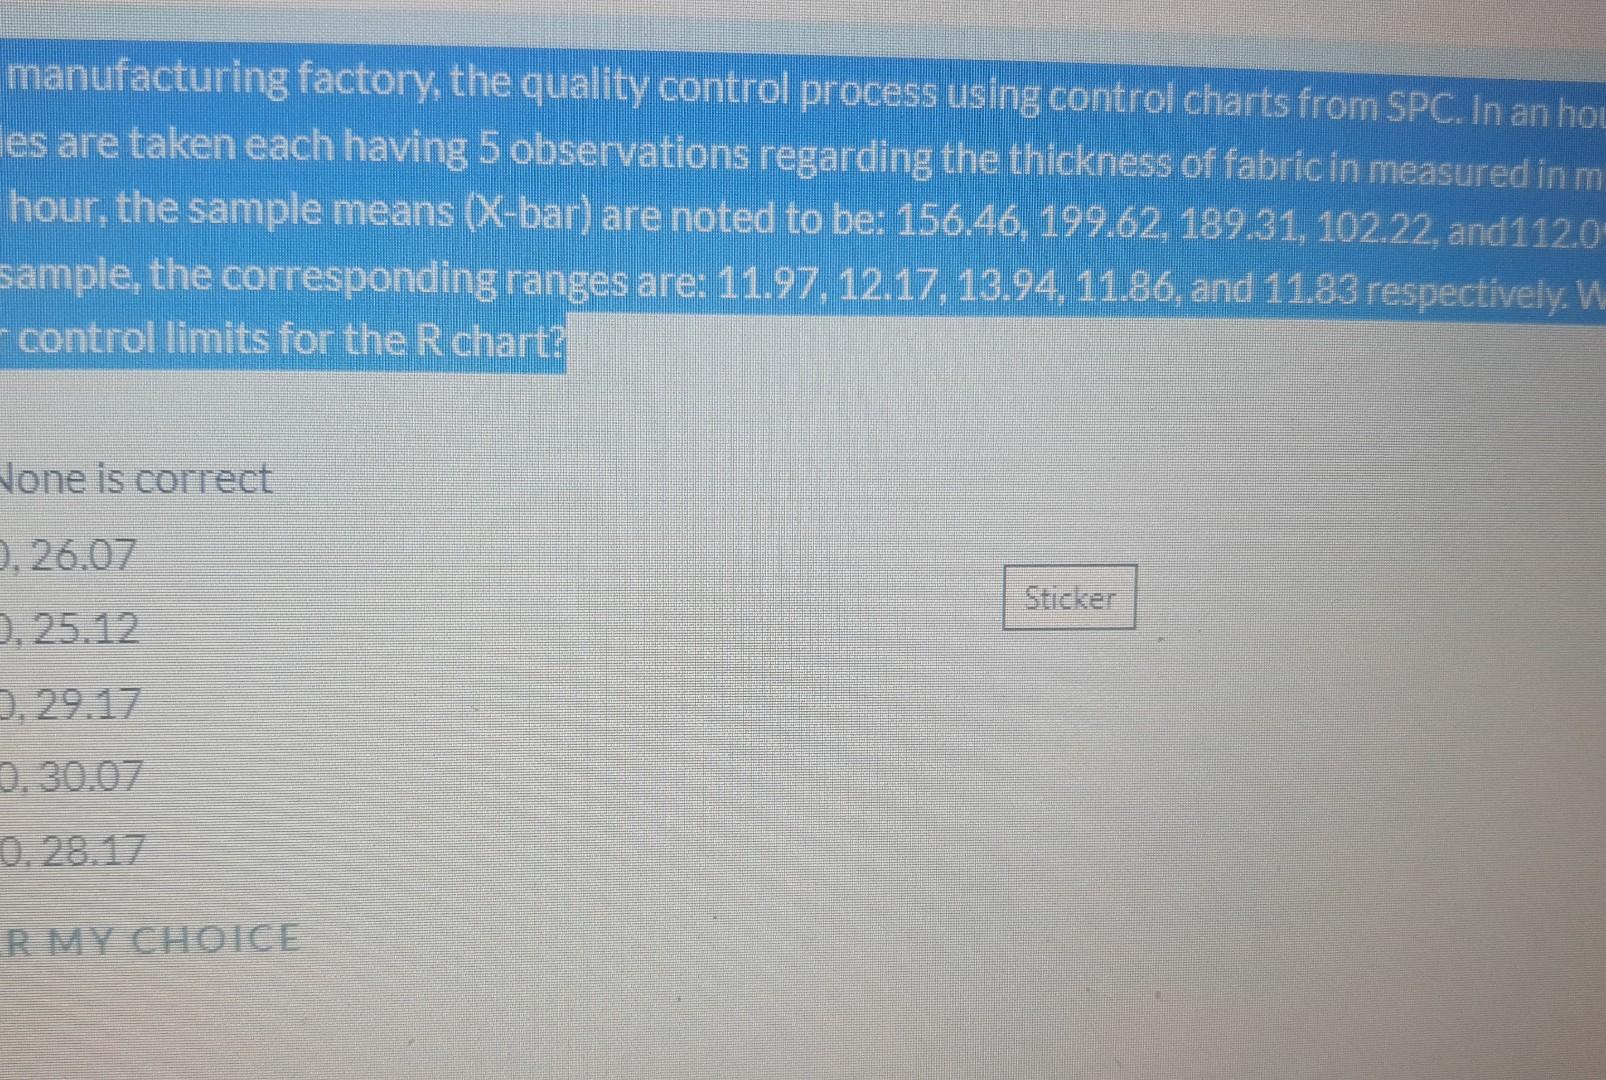
In a fabric manufacturing factory, the quality control process using control charts from SPC. In an hour there are a tota of 5 samples are taken each having 5 observations regarding the thickness of fabric in measured in millimeters. In a particular hour, the sample means (X-bar) are noted to be: 156.46, 199.62, 189.31, 102.22, and112.09 respectively. In the same sample, the corresponding ranges are: 11.97, 12.17, 13.94, 11.86, and 11.83 respectively. What are the lower and upper control limits for the R chart: None is correct b. 0,26.07 Sticker RC 0.25.12 O d. 0,29.17 0.30.07 of 0.28.17 CLEAR MY CHOICE manufacturing factory, the quality control process using control charts from SPC. In an hou les are taken each having 5 observations regarding the thickness of fabric in measured in m hour, the sample means (X-bar) are noted to be: 156.46.199.62. 189.31, 102.22, and1120 sample, the corresponding ranges are: 11.97, 12.17, 13.94, 11.86, and 11.83 respectively. W - control limits for the R charte Jone is correct 2. 26.07 Sticker 2. 25.12 0.29.17 0.30.07 0.28.17 RMY CHOICE
Step by Step Solution
There are 3 Steps involved in it
1 Expert Approved Answer
Step: 1 Unlock

Question Has Been Solved by an Expert!
Get step-by-step solutions from verified subject matter experts
Step: 2 Unlock
Step: 3 Unlock