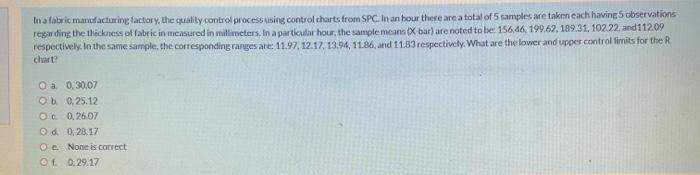
Question: In a fabric manufacturing factory, the quality control process using control charts from SPC. In an hour there are a total of 5 samples are

In a fabric manufacturing factory, the quality
In a fabric manufacturing factory, the quality control process using control charts from SPC. In an hour there are a total of 5 samples are taken cach having observations regarding the thickness of fabric in measured in millimeters. In a particular hour, the sample means(bar) are noted to be 156.46, 199.62, 189.31, 10222 and 112.09 respectively. In the same sample, the corresponding ranges are: 11.97, 12.17, 13.94, 11.86, and 11.83 respectively. What are the lower and upper control limits for the R chart O a 0,30.07 Ob 0,25.12 Oc 0.26.07 Od 0.28.17 Oc. None is correct of 0.29.17 Control Chart Table Sample Size Factor for x-Chart Factors for R.Chart A2 D3 D4 Confidence level % z-value 3 188 102 0.73 0.58 0.48 0.42 0.37 034 165 196 205 2.17 233 258 97 98 6 0.00 0.00 0.00 0.00 0.00 0.08 0.14 0.18 0.22 0.26 0.28 031 0.33 0.35 327 257 228 2.11 200 192 186 1.82 1.78 1.74 172 169 1.67 165 10 031 029 12 0.27 025 14 15 024 022

Step by Step Solution

There are 3 Steps involved in it

1 Expert Approved Answer
Step: 1 Unlock blur-text-image
Question Has Been Solved by an Expert!

Get step-by-step solutions from verified subject matter experts

Step: 2 Unlock
Step: 3 Unlock

Students Have Also Explored These Related General Management Questions!