

Question: In a process capability analysis, C_p=2 , C_pl=2/3 and C_pu=10/3. Show the location of the process distribution within the specification limits. In a process capability
 In a process capability analysis, C_p=2 , C_pl=2/3 and C_pu=10/3. Show the location of the process distribution within the specification limits.
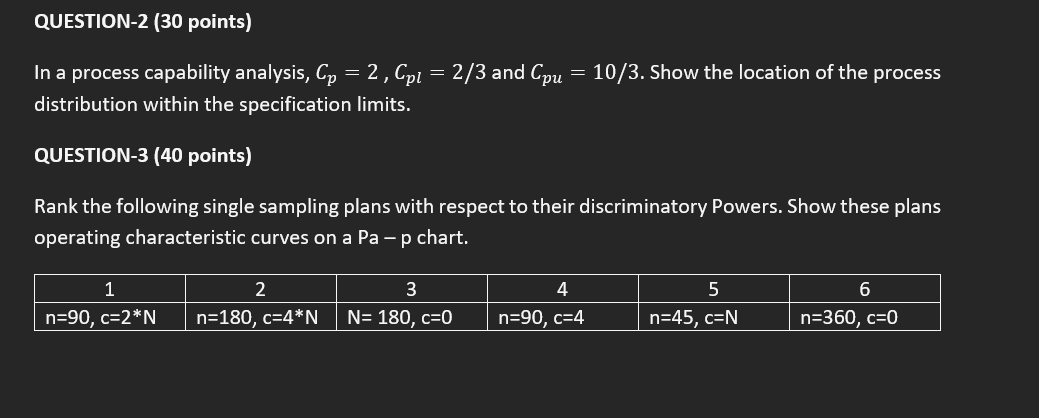
In a process capability analysis, Cp=2,Cpl=2/3 and Cpu=10/3. Show the location of the process distribution within the specification limits. QUESTION-3 (40 points) Rank the following single sampling plans with respect to their discriminatory Powers. Show these plans operating characteristic curves on a Pap chart
Step by Step Solution
There are 3 Steps involved in it
1 Expert Approved Answer
Step: 1 Unlock

Question Has Been Solved by an Expert!
Get step-by-step solutions from verified subject matter experts
Step: 2 Unlock
Step: 3 Unlock