

Question: In a QTL mapping project, 200 wheat genotypes were tested in 3 locations in Kansas over 2 years of time period. The experiment was planted
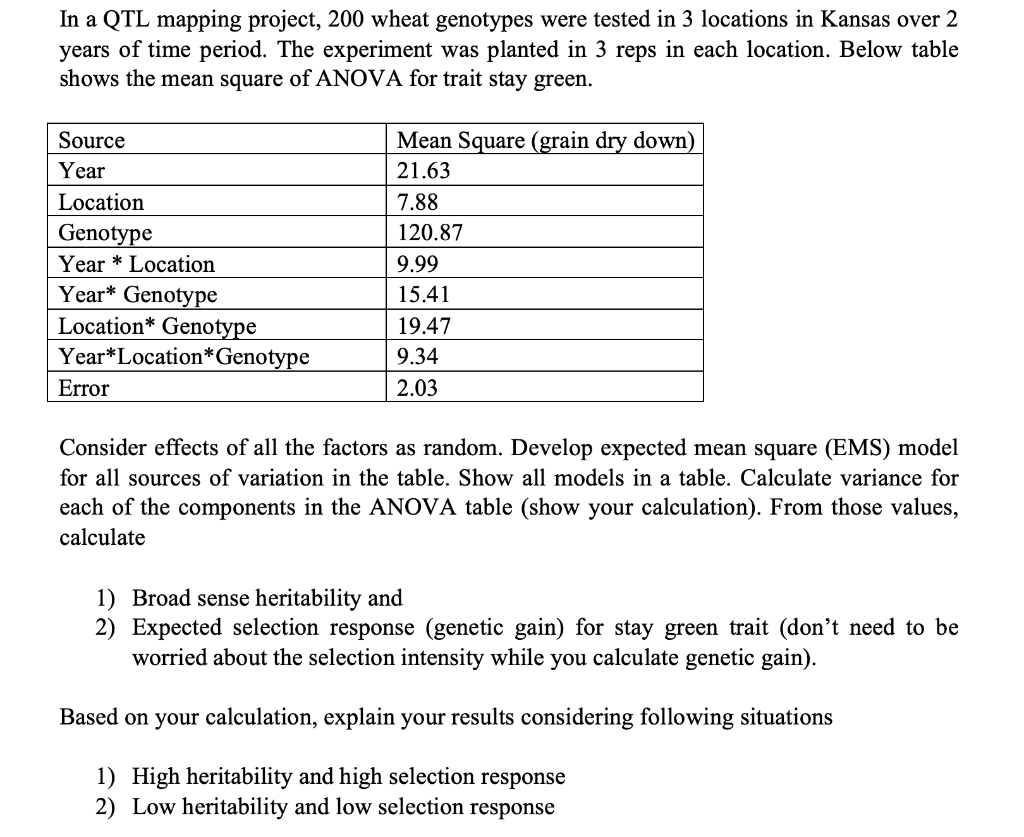
In a QTL mapping project, 200 wheat genotypes were tested in 3 locations in Kansas over 2 years of time period. The experiment was planted in 3 reps in each location. Below table shows the mean square of ANOVA for trait stay green. Source Year Location Genotype Year * Location Year* Genotype Location* Genotype Year* Location*Genotype Error Mean Square (grain dry down) 21.63 7.88 120.87 9.99 15.41 19.47 9.34 2.03 Consider effects of all the factors as random. Develop expected mean square (EMS) model for all sources of variation in the table. Show all models in a table. Calculate variance for each of the components in the ANOVA table (show your calculation). From those values, calculate 1) Broad sense heritability and 2) Expected selection response (genetic gain) for stay green trait (don't need to be worried about the selection intensity while you calculate genetic gain). Based on your calculation, explain your results considering following situations 1) High heritability and high selection response 2) Low heritability and low selection response In a QTL mapping project, 200 wheat genotypes were tested in 3 locations in Kansas over 2 years of time period. The experiment was planted in 3 reps in each location. Below table shows the mean square of ANOVA for trait stay green. Source Year Location Genotype Year * Location Year* Genotype Location* Genotype Year* Location*Genotype Error Mean Square (grain dry down) 21.63 7.88 120.87 9.99 15.41 19.47 9.34 2.03 Consider effects of all the factors as random. Develop expected mean square (EMS) model for all sources of variation in the table. Show all models in a table. Calculate variance for each of the components in the ANOVA table (show your calculation). From those values, calculate 1) Broad sense heritability and 2) Expected selection response (genetic gain) for stay green trait (don't need to be worried about the selection intensity while you calculate genetic gain). Based on your calculation, explain your results considering following situations 1) High heritability and high selection response 2) Low heritability and low selection response
Step by Step Solution
There are 3 Steps involved in it

Get step-by-step solutions from verified subject matter experts