

Question: In a recent study 272 moderately obese subjects were randomly assigned to one of three diets: low-fat, restricted-calorie; Mediterranean, restricted-calorie; or low-carbohydrate, nonrestricted-calorie. The prediction
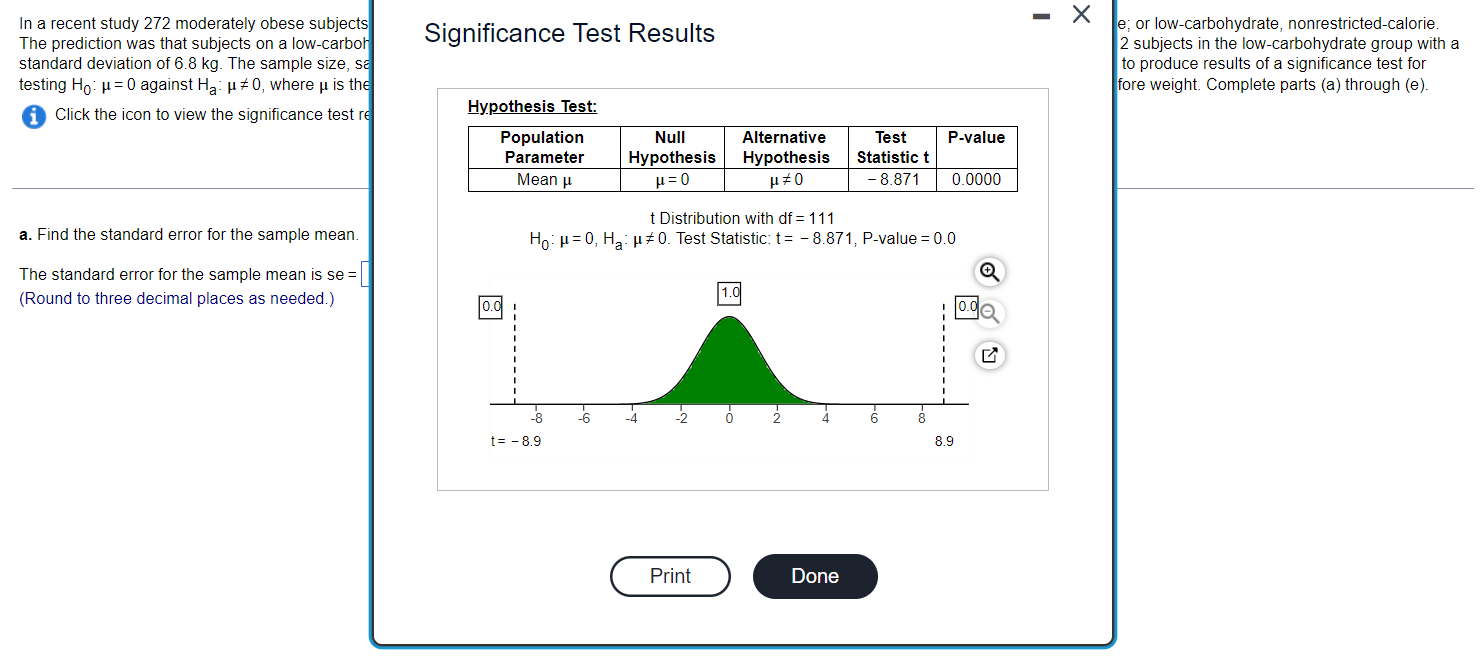
In a recent study 272 moderately obese subjects were randomly assigned to one of three diets: low-fat, restricted-calorie; Mediterranean, restricted-calorie; or low-carbohydrate, nonrestricted-calorie. The prediction was that subjects on a low-carbohydrate diet would lose weight, on the average. After two years, the mean change was - 5.7 kg for the 112 subjects in the low-carbohydrate group with a standard deviation of 6.8 kg. The sample size, sample mean, and sample standard deviation (which is all the information needed for the t test) were used to produce results of a significance test for testing Ho: H= 0 against Ha: #0, where u is the population mean weight change. Note that weight change is determined by calculating after weight - before weight. Complete parts (a) through (e). i Click the icon to view the significance test results. a. Find the standard error for the sample mean. The standard error for the sample mean is se = (Round to three decimal places as needed.)In a recent study 272 moderately obese subjects - X e; or low-carbohydrate, nonrestricted-calorie. The prediction was that subjects on a low-carboh Significance Test Results 2 subjects in the low-carbohydrate group with a standard deviation of 6.8 kg. The sample size, sa to produce results of a significance test for testing Ho: H = 0 against Ha: u # 0, where u is the fore weight. Complete parts (a) through (e). i Click the icon to view the significance test re Hypothesis Test: Population Null Alternative Test P-value Parameter Hypothesis Hypothesis Statistic t Mean u H = 0 - 8.871 0.0000 t Distribution with df = 111 a. Find the standard error for the sample mean. Ho: H = 0, Ha: H#0. Test Statistic: t= - 8.871, P-value = 0.0 The standard error for the sample mean is se = (Round to three decimal places as needed.) 1.0 0.0 10.90 -8 -6 - 2 0 N- CO- t= - 8.9 8.9 Print Done
Step by Step Solution
There are 3 Steps involved in it

Get step-by-step solutions from verified subject matter experts