

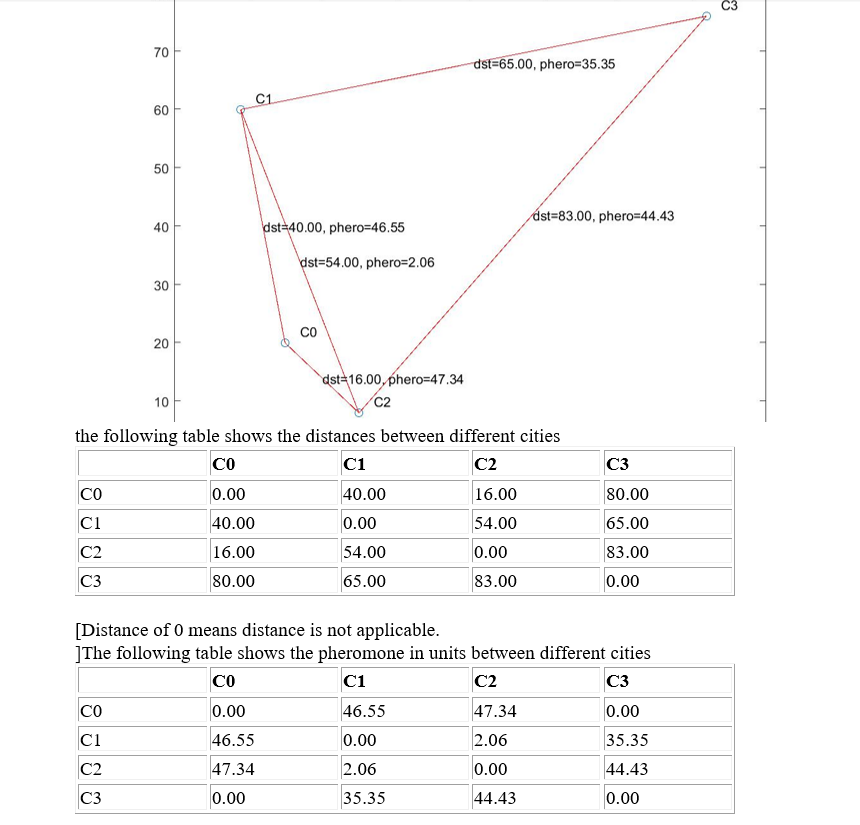
Question: In a TSP problem with 4 cities, cities are connected as shown in the figure: the following table shows the distances between different cities
In a TSP problem with cities, cities are connected as shown in the figure:
the following table shows the distances between different cities
tableCCCCCCCC
Distance of means distance is not applicable.
The following table shows the pheromone in units between different cities
tableCCCCCCCC
Assume that an ant has followed the following route: and back to source
a Calculate the total cost of the above route.
b Calculate the ant's switching probabilities for the first steps in the above route assuming pheromone exponent parameter alpha and heuristic exponent parameter beta
c Calculate the updated pheromone amounts after applying the ACO evaporation step assuming rho
d Calculate the updated pheromone amounts after applying the ACO depositing step assuming Q
e Comment on the update with regard to the optimization task convergence
Step by Step Solution
There are 3 Steps involved in it
1 Expert Approved Answer
Step: 1 Unlock

Question Has Been Solved by an Expert!
Get step-by-step solutions from verified subject matter experts
Step: 2 Unlock
Step: 3 Unlock