

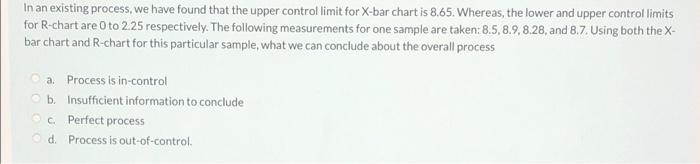
Question: In an existing process, we have found that the upper controllimit for X-bar chart is 8.65. Whereas, the lower and upper control limits for R-chart
Step by Step Solution
There are 3 Steps involved in it
1 Expert Approved Answer
Step: 1 Unlock

Question Has Been Solved by an Expert!
Get step-by-step solutions from verified subject matter experts
Step: 2 Unlock
Step: 3 Unlock