

Question: In an HPLC separation using a 10 cm long column, peaks for analyte i and j are observed. The peak parameters are: Analyte i j
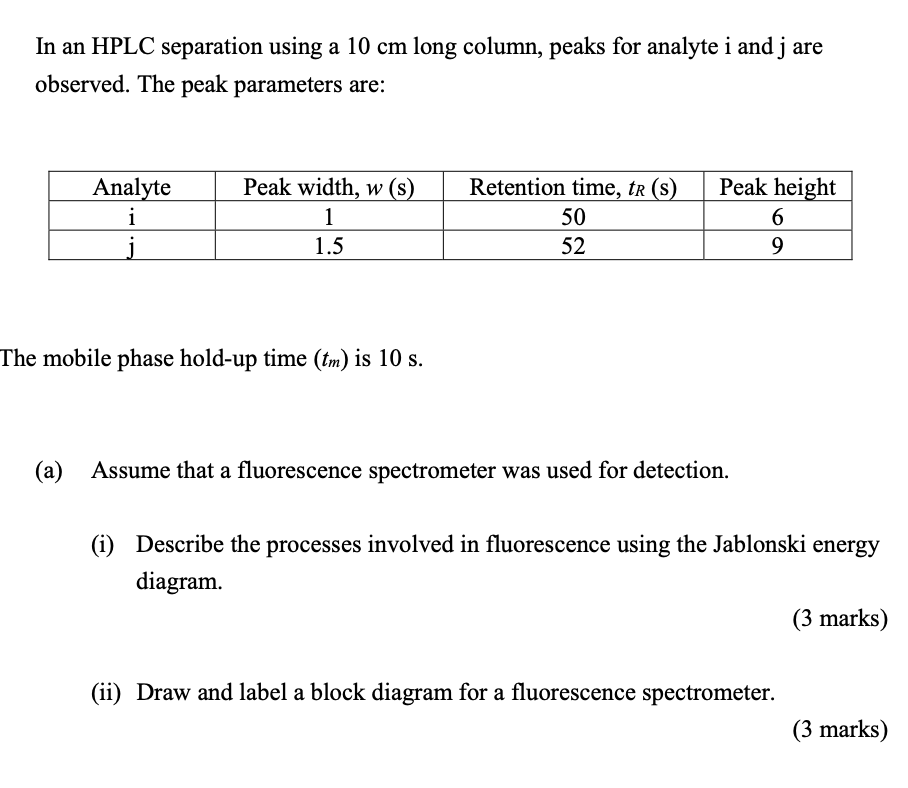
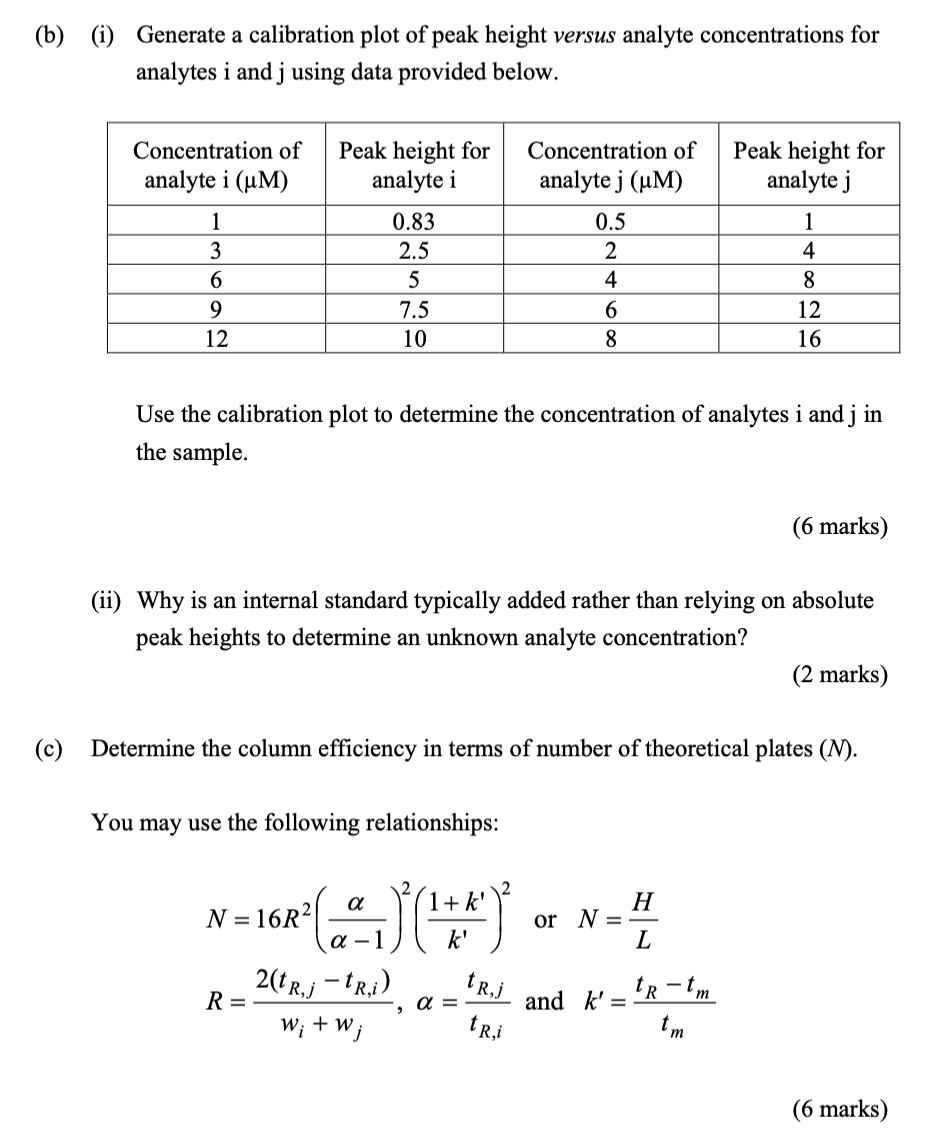
In an HPLC separation using a 10 cm long column, peaks for analyte i and j are observed. The peak parameters are: Analyte i j Peak width, w(s) 1 1.5 Retention time, tr(s) 50 52 Peak height 6 9 The mobile phase hold-up time (tm) is 10 s. (a) Assume that a fluorescence spectrometer was used for detection. (i) Describe the processes involved in fluorescence using the Jablonski energy diagram. (3 marks) (ii) Draw and label a block diagram for a fluorescence spectrometer. (3 marks) (b) (i) Generate a calibration plot of peak height versus analyte concentrations for analytes i and j using data provided below. Concentration of analyte i (uM) Peak height for analyte i Concentration of analyte j (UM) Peak height for analyte j 1 4 1 3 6 9 12 0.83 2.5 5 7.5 10 0.5 2 4 6 8 8 12 16 Use the calibration plot to determine the concentration of analytes i and j in the sample. (6 marks) (ii) Why is an internal standard typically added rather than relying on absolute peak heights to determine an unknown analyte concentration? (2 marks) (c) Determine the column efficiency in terms of number of theoretical plates (N). You may use the following relationships: 1+ k' k' H or N = L a N = 16R2 a - 1 2te, -1R,i) W; + W; tRj R= a = to-tm and k' = tm tri (6 marks) In an HPLC separation using a 10 cm long column, peaks for analyte i and j are observed. The peak parameters are: Analyte i j Peak width, w(s) 1 1.5 Retention time, tr(s) 50 52 Peak height 6 9 The mobile phase hold-up time (tm) is 10 s. (a) Assume that a fluorescence spectrometer was used for detection. (i) Describe the processes involved in fluorescence using the Jablonski energy diagram. (3 marks) (ii) Draw and label a block diagram for a fluorescence spectrometer. (3 marks) (b) (i) Generate a calibration plot of peak height versus analyte concentrations for analytes i and j using data provided below. Concentration of analyte i (uM) Peak height for analyte i Concentration of analyte j (UM) Peak height for analyte j 1 4 1 3 6 9 12 0.83 2.5 5 7.5 10 0.5 2 4 6 8 8 12 16 Use the calibration plot to determine the concentration of analytes i and j in the sample. (6 marks) (ii) Why is an internal standard typically added rather than relying on absolute peak heights to determine an unknown analyte concentration? (2 marks) (c) Determine the column efficiency in terms of number of theoretical plates (N). You may use the following relationships: 1+ k' k' H or N = L a N = 16R2 a - 1 2te, -1R,i) W; + W; tRj R= a = to-tm and k' = tm tri (6 marks)
Step by Step Solution
There are 3 Steps involved in it

Get step-by-step solutions from verified subject matter experts