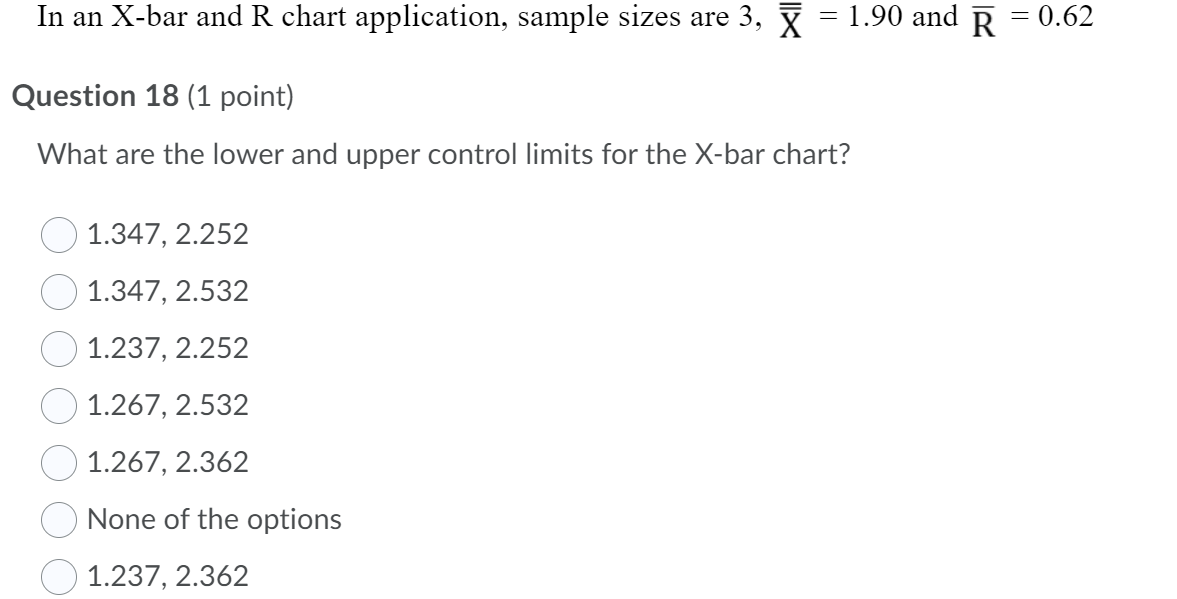
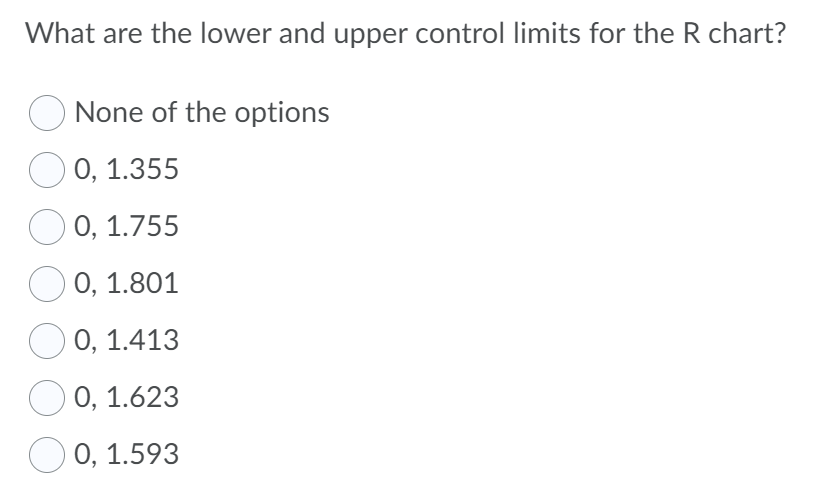
Question: In an X-bar and R chart application, sample sizes are 3, = 1.90 and R = 0.62 Question 18 (1 point) What are the lower

In an X-bar and R chart application, sample sizesIn an X-bar and R chart application, sample sizes

In an X-bar and R chart application, sample sizes are 3, = 1.90 and R = 0.62 Question 18 (1 point) What are the lower and upper control limits for the X-bar chart? 1.347, 2.252 1.347, 2.532 1.237, 2.252 1.267, 2.532 1.267, 2.362 None of the options 1.237, 2.362 What are the lower and upper control limits for the R chart? None of the options 0, 1.355 O 0, 1.755 O, 1.801 O 0, 1.413 O, 1.623 0, 1.593

Step by Step Solution

There are 3 Steps involved in it

1 Expert Approved Answer
Step: 1 Unlock blur-text-image
Question Has Been Solved by an Expert!

Get step-by-step solutions from verified subject matter experts

Step: 2 Unlock
Step: 3 Unlock

Students Have Also Explored These Related General Management Questions!