

Question: IN ATTACHED IMAGE IS A CASE - BASED ON READING THAT PLEASE ADVISE Suppose Mercedes is concerned that dealer prices of the CLK350 Coupe are
IN ATTACHED IMAGE IS A CASE - BASED ON READING THAT PLEASE ADVISE
- Suppose Mercedes is concerned that dealer prices of the CLK350 Coupe are not consistent and that even though the average price is $44,520, actual prices are normally distributed with a standard deviation of $2,981. Suppose also that Mercedes believes that at $43,000, the CLK350 Coupe is priced out of the BMW 3 Series Coupe 335i market. What percentage of the dealer prices for the Mercedes CLK350 Coupe is more than $43,000 and hence priced out of the BMW 3 Series Coupe 335i market? The average price for a BMW 3 Series Coupe 335i is $39,368. Suppose these prices are also normally distributed with a standard deviation of $2,367. What percentage of BMW dealers are pricing the BMW 3 Series Coupe 335i at more than the average price for a Mercedes CLK350 Coupe? What might this mean to BMW if dealers were pricing the 3 Series Couple 351 at this level? What percentage of Mercedes dealers are pricing the CLK350 Couple at less than the average price of a BMW 3 Series Coupe 335i?
- Suppose that highway gas mileage rates for both of these cares are uniformly distributed over a range of from 20 to 30 mpg. What proportion of these cars would fall into the 22 to 27 mpg range? Compute the proportion of cars that get more than 28 mpg. What proportion of cars would get less than 23 mpg?
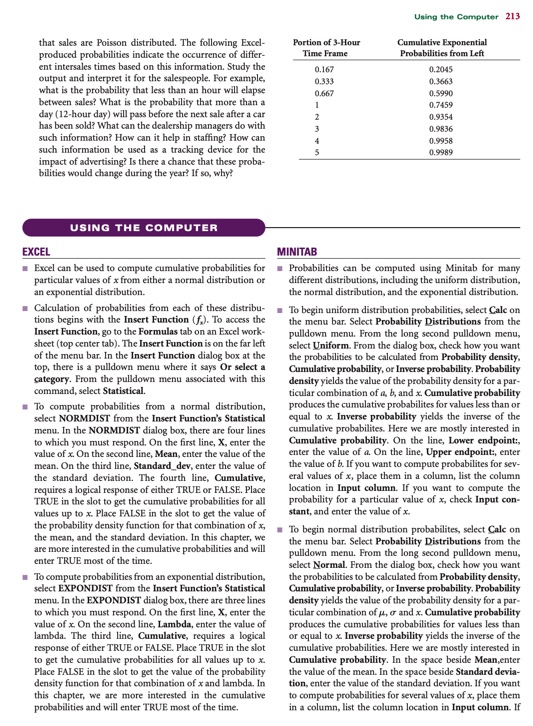
- Suppose that in one dealership an average of 1.37 CLKs is sold every 3 hours (during a 12-hour showroom day) andthat sales are Poisson distributed. The following Excel- produced probabilities indicate the occurrence of differ- ent intersales times based on this information. Study the output and interpret it for the salespeople. For example, what is the probability that less than an hour will elapse between sales? What is the probability that more than a day (12-hour day) will pass before the next sale after a car has been sold? What can the dealership managers do with such information? How can it help in staffing? How can such information be used as a tracking device for the impact of advertising? Is there a chance that these proba- bilities would change during the year? If so, why?


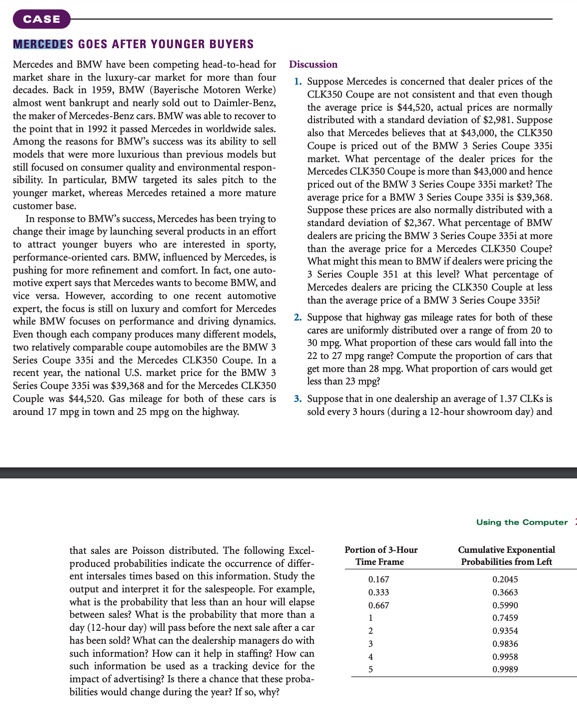
CASE MERCEDES GOES AFTER YOUNGER BUYERS Mercedes and BMW have been competing head-to-head for Discussion market share in the luxury-car market for more than four decades. Back in 1959, BMW (Bayerische Motoren Werke) 1. Suppose Mercedes is concerned that dealer prices of the CLK350 Coupe are not consistent and that even though almost went bankrupt and nearly sold out to Daimler-Benz, the average price is $44,520, actual prices are normally the maker of Mercedes-Benz cars. BMW was able to recover to distributed with a standard deviation of $2,981. Suppose the point that in 1992 it passed Mercedes in worldwide sales. also that Mercedes believes that at $43,000, the CLK350 Among the reasons for BMW's success was its ability to sell Coupe is priced out of the BMW 3 Series Coupe 335i models that were more luxurious than previous models but market. What percentage of the dealer prices for the still focused on consumer quality and environmental respons Mercedes CLK350 Coupe is more than $43,000 and hence sibility. In particular, BMW targeted its sales pitch to the priced out of the BMW 3 Series Coupe 335i market? The younger market, whereas Mercedes retained a more mature average price for a BMW 3 Series Coupe 335i is $39,368. customer base. Suppose these prices are also normally distributed with a In response to BMW's success, Mercedes has been trying to standard deviation of $2,367. What percentage of BMW change their image by launching several products in an effort dealers are pricing the BMW 3 Series Coupe 335i at more to attract younger buyers who are interested in sporty, than the average price for a Mercedes CLK350 Coupe? performance-oriented cars. BMW, influenced by Mercedes, is What might this mean to BMW if dealers were pricing the pushing for more refinement and comfort. In fact, one auto- 3 Series Couple 351 at this level? What percentage of motive expert says that Mercedes wants to become BMW, and Mercedes dealers are pricing the CLK350 Couple at less vice versa. However, according to one recent automotive than the average price of a BMW 3 Series Coupe 335i? expert, the focus is still on luxury and comfort for Mercedes while BMW focuses on performance and driving dynamics. 2. Suppose that highway gas mileage rates for both of these Even though each company produces many different models, cares are uniformly distributed over a range of from 20 to two relatively comparable coupe automobiles are the BMW 3 30 mpg. What proportion of these cars would fall into the Series Coupe 335i and the Mercedes CLK350 Coupe. In a 22 to 27 mpg range? Compute the proportion of cars that recent year, the national U.S. market price for the BMW 3 get more than 28 mpg. What proportion of cars would get Series Coupe 335i was $39,368 and for the Mercedes CLK350 less than 23 mpg? Couple was $44,520. Gas mileage for both of these cars is 3. Suppose that in one dealership an average of 1.37 CLKs is around 17 mpg in town and 25 mpg on the highway. sold every 3 hours (during a 12-hour showroom day) and Using the Computer that sales are Poisson distributed. The following Excel- Portion of 3-Hour Cumulative Exponential produced probabilities indicate the occurrence of differ- Time Frame Probabilities from Left ent intersales times based on this information. Study the 0.167 0.2045 output and interpret it for the salespeople. For example, 0.333 0.3663 what is the probability that less than an hour will elapse 0.667 0.5990 between sales? What is the probability that more than a 0.7459 day (12-hour day) will pass before the next sale after a car 0.9354 has been sold? What can the dealership managers do with 0.9836 such information? How can it help in staffing? How can 0.9958 such information be used as a tracking device for the 0.9989 impact of advertising? Is there a chance that these proba- bilities would change during the year? If so, why?Using the Computer 213 that sales are Poisson distributed. The following Excel- Portion of 3-Hour Cumulative Exponential produced probabilities indicate the occurrence of differ- Time Frame Probabilities from Left ent intersales times based on this information. Study the 0,167 0.2045 output and interpret it for the salespeople. For example, 0.333 0.3663 what is the probability that less than an hour will elapse 0.667 0.5990 between sales? What is the probability that more than a 0.7459 day (12-hour day) will pass before the next sale after a car 0.9354 has been sold? What can the dealership managers do with 0.9836 such information? How can it help in staffing? How can 0.9958 such information be used as a tracking device for the 0.9989 impact of advertising? Is there a chance that these proba- bilities would change during the year! If so, why? USING THE COMPUTER EXCEL MINITAB IExcel can be used to compute cumulative probabilities for Probabilities can be computed using Minitab for many particular values of x from either a normal distribution or different distributions, including the uniform distribution, an exponential distribution. the normal distribution, and the exponential distribution. Calculation of probabilities from each of these distribu- . To begin uniform distribution probabilities, select Cale on tions begins with the Insert Function (f.). To access the the menu bar. Select Probability Distributions from the Insert Function, go to the Formulas tab on an Excel work- pulldown menu. From the long second pulldown menu, sheet (top center tab). The Insert Function is on the far left select Uniform. From the dialog box, check how you want of the menu bar. In the Insert Function dialog box at the the probabilities to be calculated from Probability density, top, there is a pulldown menu where it says Or select a Cumulative probability, or Inverse probability. Probability category. From the pulldown menu associated with this density yields the value of the probability density for a par- command, select Statistical. ticular combination of a b, and x. Cumulative probability To compute probabilities from a normal distribution, produces the cumulative probabilites for values less than or select NORMDIST from the Insert Function's Statistical equal to x Inverse probability yields the inverse of the menu. In the NORMDIST dialog box, there are four lines cumulative probabilites. Here we are mostly interested in to which you must respond. On the first line, X, enter the Cumulative probability. On the line, Lower endpoints, value of x. On the second line, Mean, enter the value of the enter the value of a. On the line, Upper endpoint:, enter mean. On the third line, Standard_dev, enter the value of the value of b. If you want to compute probabilites for sev the standard deviation. The fourth line, Cumulative, eral values of x, place them in a column, list the column requires a logical response of either TRUE or FALSE. Place location in Input column. If you want to compute the TRUE in the slot to get the cumulative probabilities for all probability for a particular value of x, check Input con- values up to x. Place FALSE in the slot to get the value of stant, and enter the value of x. the probability density function for that combination of x To begin normal distribution probabilites, select Calc on the mean, and the standard deviation. In this chapter, we are more interested in the cumulative probabilities and will the menu bar. Select Probability Distributions from the pulldown menu. From the long second pulldown menu, enter TRUE most of the time. select Normal. From the dialog box, check how you want To compute probabilities from an exponential distribution, the probabilities to be calculated from Probability density, select EXPONDIST from the Insert Function's Statistical Cumulative probability, or Inverse probability. Probability menu. In the EXPONDIST dialog box, there are three lines density yields the value of the probability density for a par- to which you must respond. On the first line, X, enter the ticular combination of #, of and x. Cumulative probability value of x On the second line, Lambda, enter the value of produces the cumulative probabilities for values less than lambda. The third line, Cumulative, requires a logical or equal to x Inverse probability yields the inverse of the response of either TRUE or FALSE. Place TRUE in the slot cumulative probabilities. Here we are mostly interested in to get the cumulative probabilities for all values up to x. Cumulative probability. In the space beside Mean,enter Place FALSE in the slot to get the value of the probability the value of the mean. In the space beside Standard devia- density function for that combination of x and lambda, In tion, enter the value of the standard deviation. If you want this chapter, we are more interested in the cumulative to compute probabilities for several values of x, place them probabilities and will enter TRUE most of the time. in a column, list the column location in Input column. If
Step by Step Solution
There are 3 Steps involved in it

Get step-by-step solutions from verified subject matter experts