

Question: In Chapter 1. we studied the problem of a projectile being launched at an angle of theta at an initial velocity of v. the equations
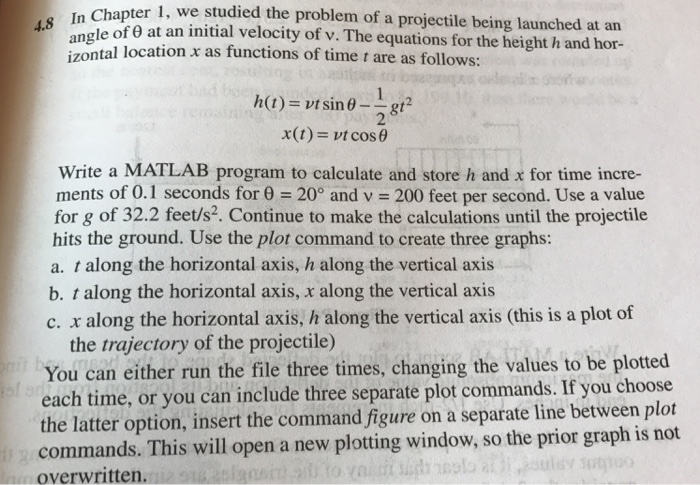
In Chapter 1. we studied the problem of a projectile being launched at an angle of theta at an initial velocity of v. the equations for the height h and horizontal location x as functions of time t are as follows: h (t) = vt sin theta - 1/2 gt^2 x (t) = vt cos theta Write MATLAB program to calculate and store h and x for time increments of 0.1 seconds for theta = 20 degree and v = 200 feet per second. Use a value for g of 32.2 feet/s^2. Continue to make the calculations until the projectile hits the ground. Use the plot command to create three graphs: t along the horizontal axis, h along the vertical axis t along the horizontal axis, x along the vertical axis x along the horizontal axis, h along the vertical axis (this is a plot of the trajectory of the projectile) You can either run the file three times, changing the values to be plotted each time, or you can include three separate plot commands. If you choose the latter option, insert the command figure on a separate line between plot commands. This will open a new plotting window, so the prior graph is not overwritten
Step by Step Solution
There are 3 Steps involved in it

Get step-by-step solutions from verified subject matter experts